
Quick answer: U.S. diesel set an all-time high of $6.529 a gallon in the week of September 21, 2026, and was still $6.276 on October 19, up 73% from a year earlier (EIA). Freight rates rose too, even without fuel: Cass's truckload linehaul index was up 10.1% year over year in September, and the government's price index for long-distance truckload hit a record 219.4. Shippers spent 20.4% more in September to move 1.9% more freight. By Yolda's estimate, fuel now costs about $0.83 a mile, up from $0.48 in 2025, which is roughly $34,000 more per 100,000 miles.
This report pulls the numbers small fleets and owner-operators ask about most into one place. Every figure is from a public source named under its chart, and the methodology at the end explains each calculation. You may quote any number or reuse any chart with a link back to this page.
Key takeaways
- Diesel: $6.276 a gallon on October 19, 2026, up $2.656 from a year earlier. The September 21 reading of $6.529 beat the previous record of $5.81 from June 2022. Diesel has been above that old record in 7 weeks of 2026.
- Fuel cost per mile: about $0.83 at today's price, against $0.48 in 2025 (Yolda estimate built on ATRI's cost data).
- Rates without fuel are up: the Cass Truckload Linehaul Index rose 10.1% year over year in September. DAT spot linehaul rates were up 28% to 34% in the week of September 27 to October 3.
- Truckload prices are at a record: the Producer Price Index for long-distance truckload reached 219.4 in September, above its March 2022 peak of 211.1, and 17.9% higher than a year earlier.
- Shippers pay more for about the same freight: Cass expenditures rose 20.4% year over year in September while shipments rose 1.9%.
- Capacity is not growing: truck transportation employment was 1,473,100 in September, about 115,000 below its October 2022 peak and flat on a year earlier.
- Fuel is the industry's top worry: fuel prices jumped 17 places to No. 1 on ATRI's 2026 list of trucking's top issues.
Diesel: a new all-time high
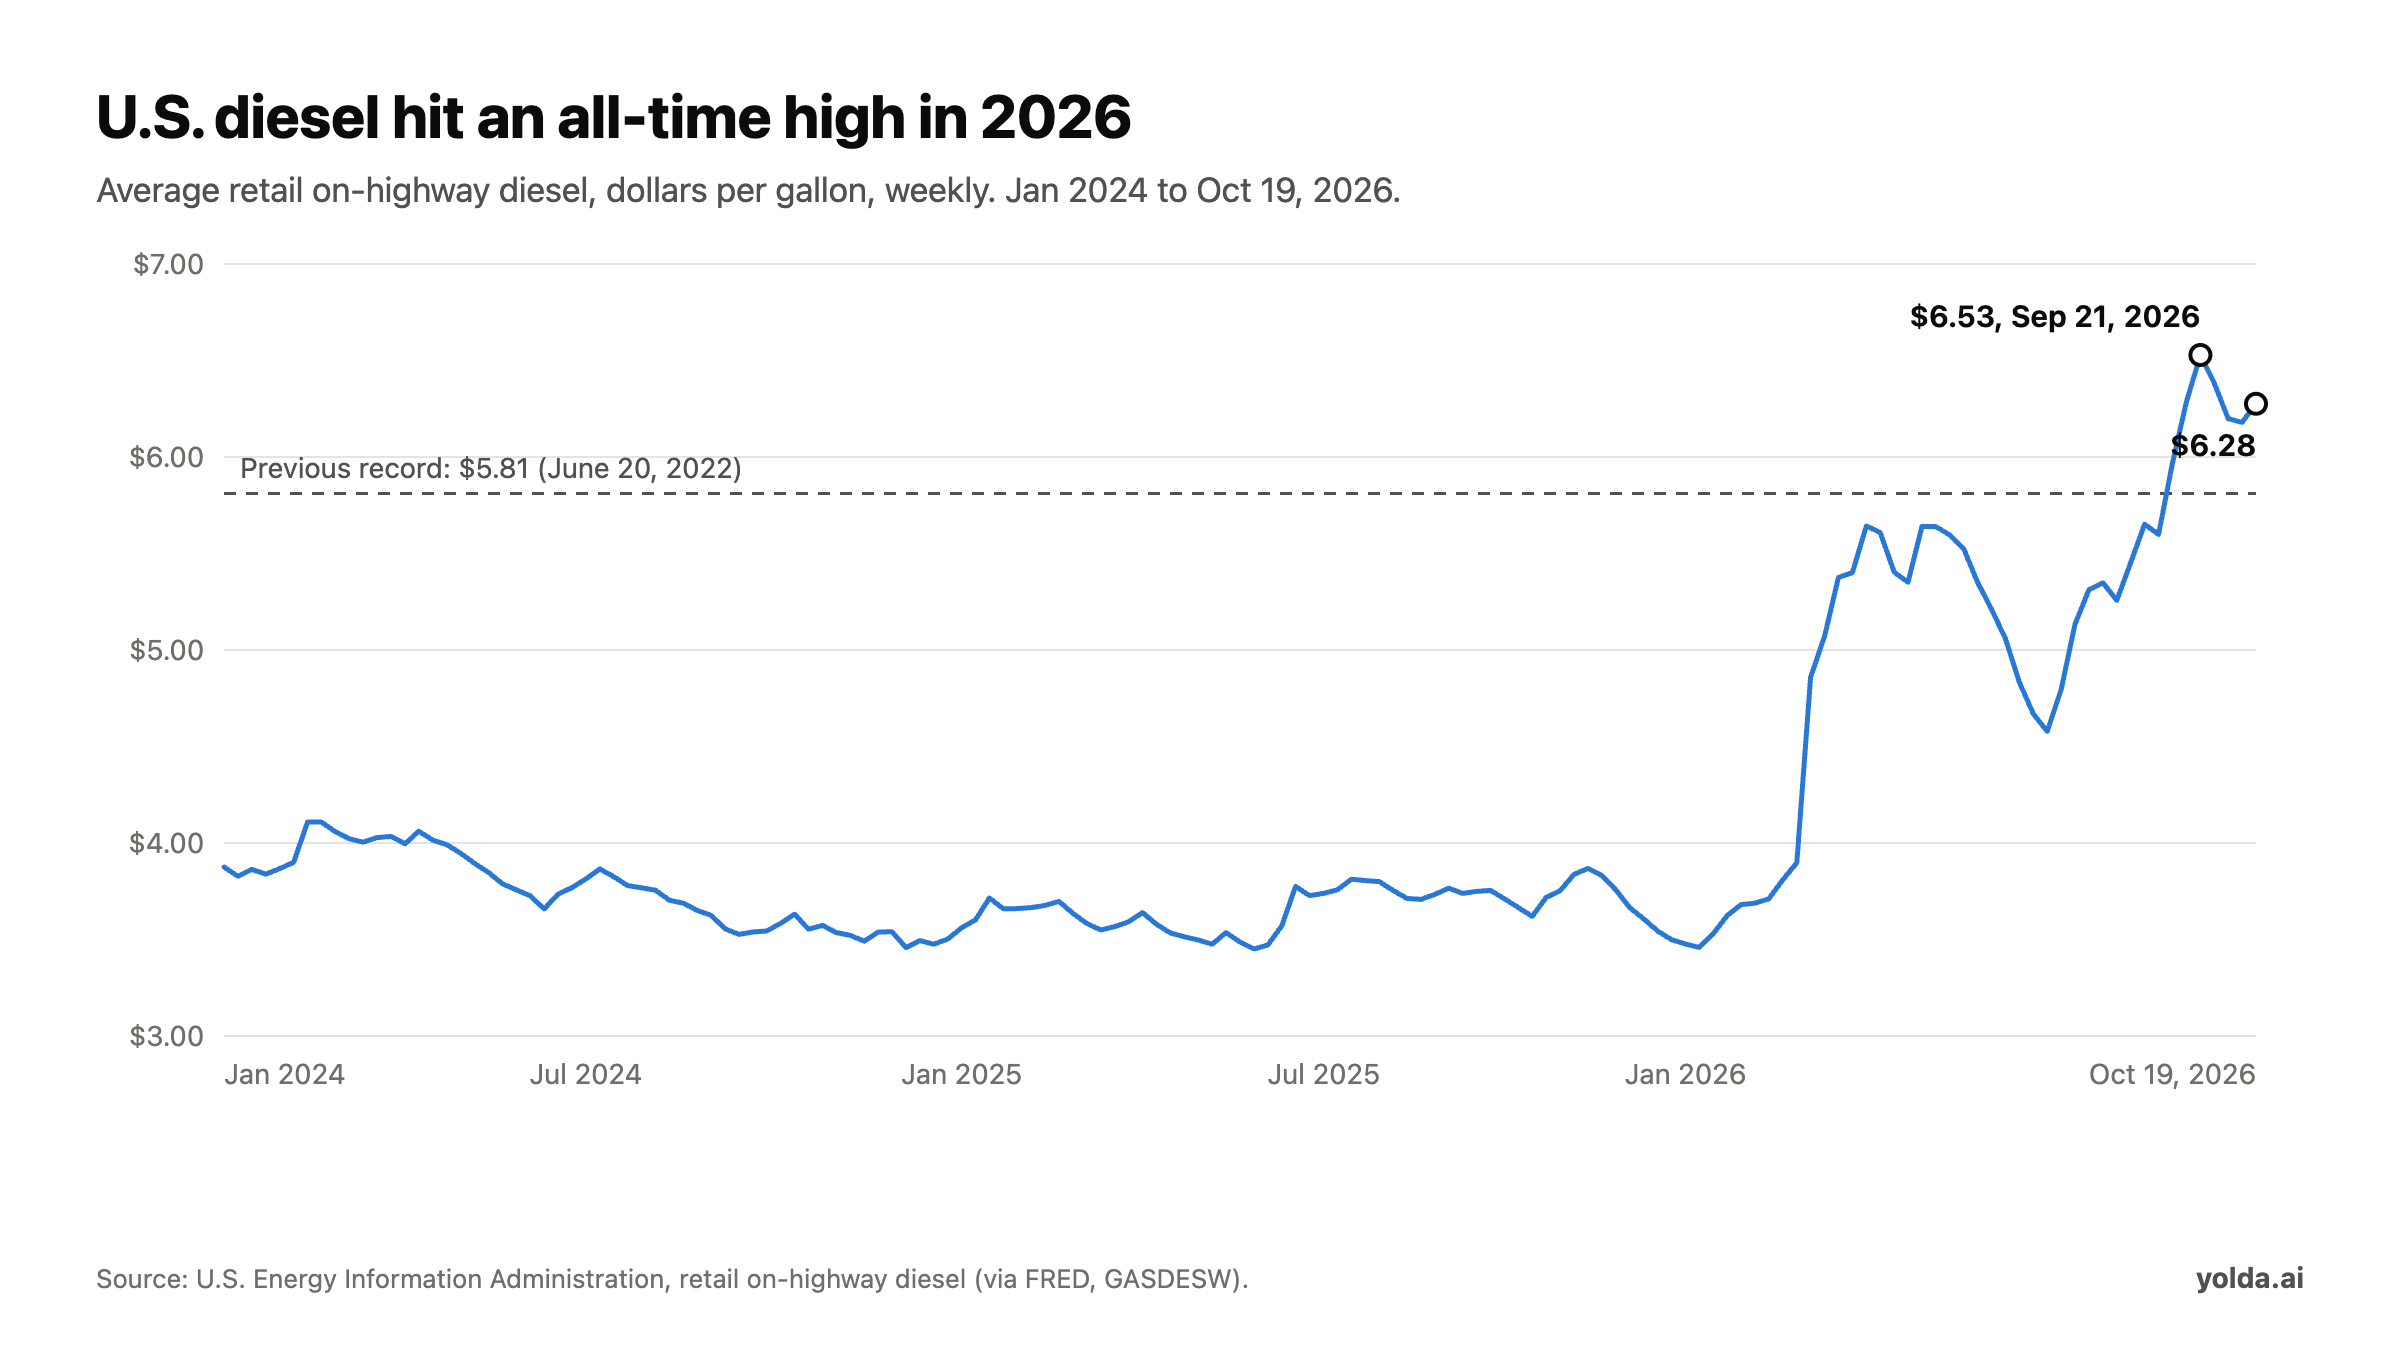
The U.S. Energy Information Administration's weekly average for on-highway diesel reached $6.529 on September 21, 2026. That is the highest figure in EIA's weekly series, which starts in 1994, and it beat the previous high of $5.81 from June 20, 2022. These are nominal prices, not adjusted for inflation.
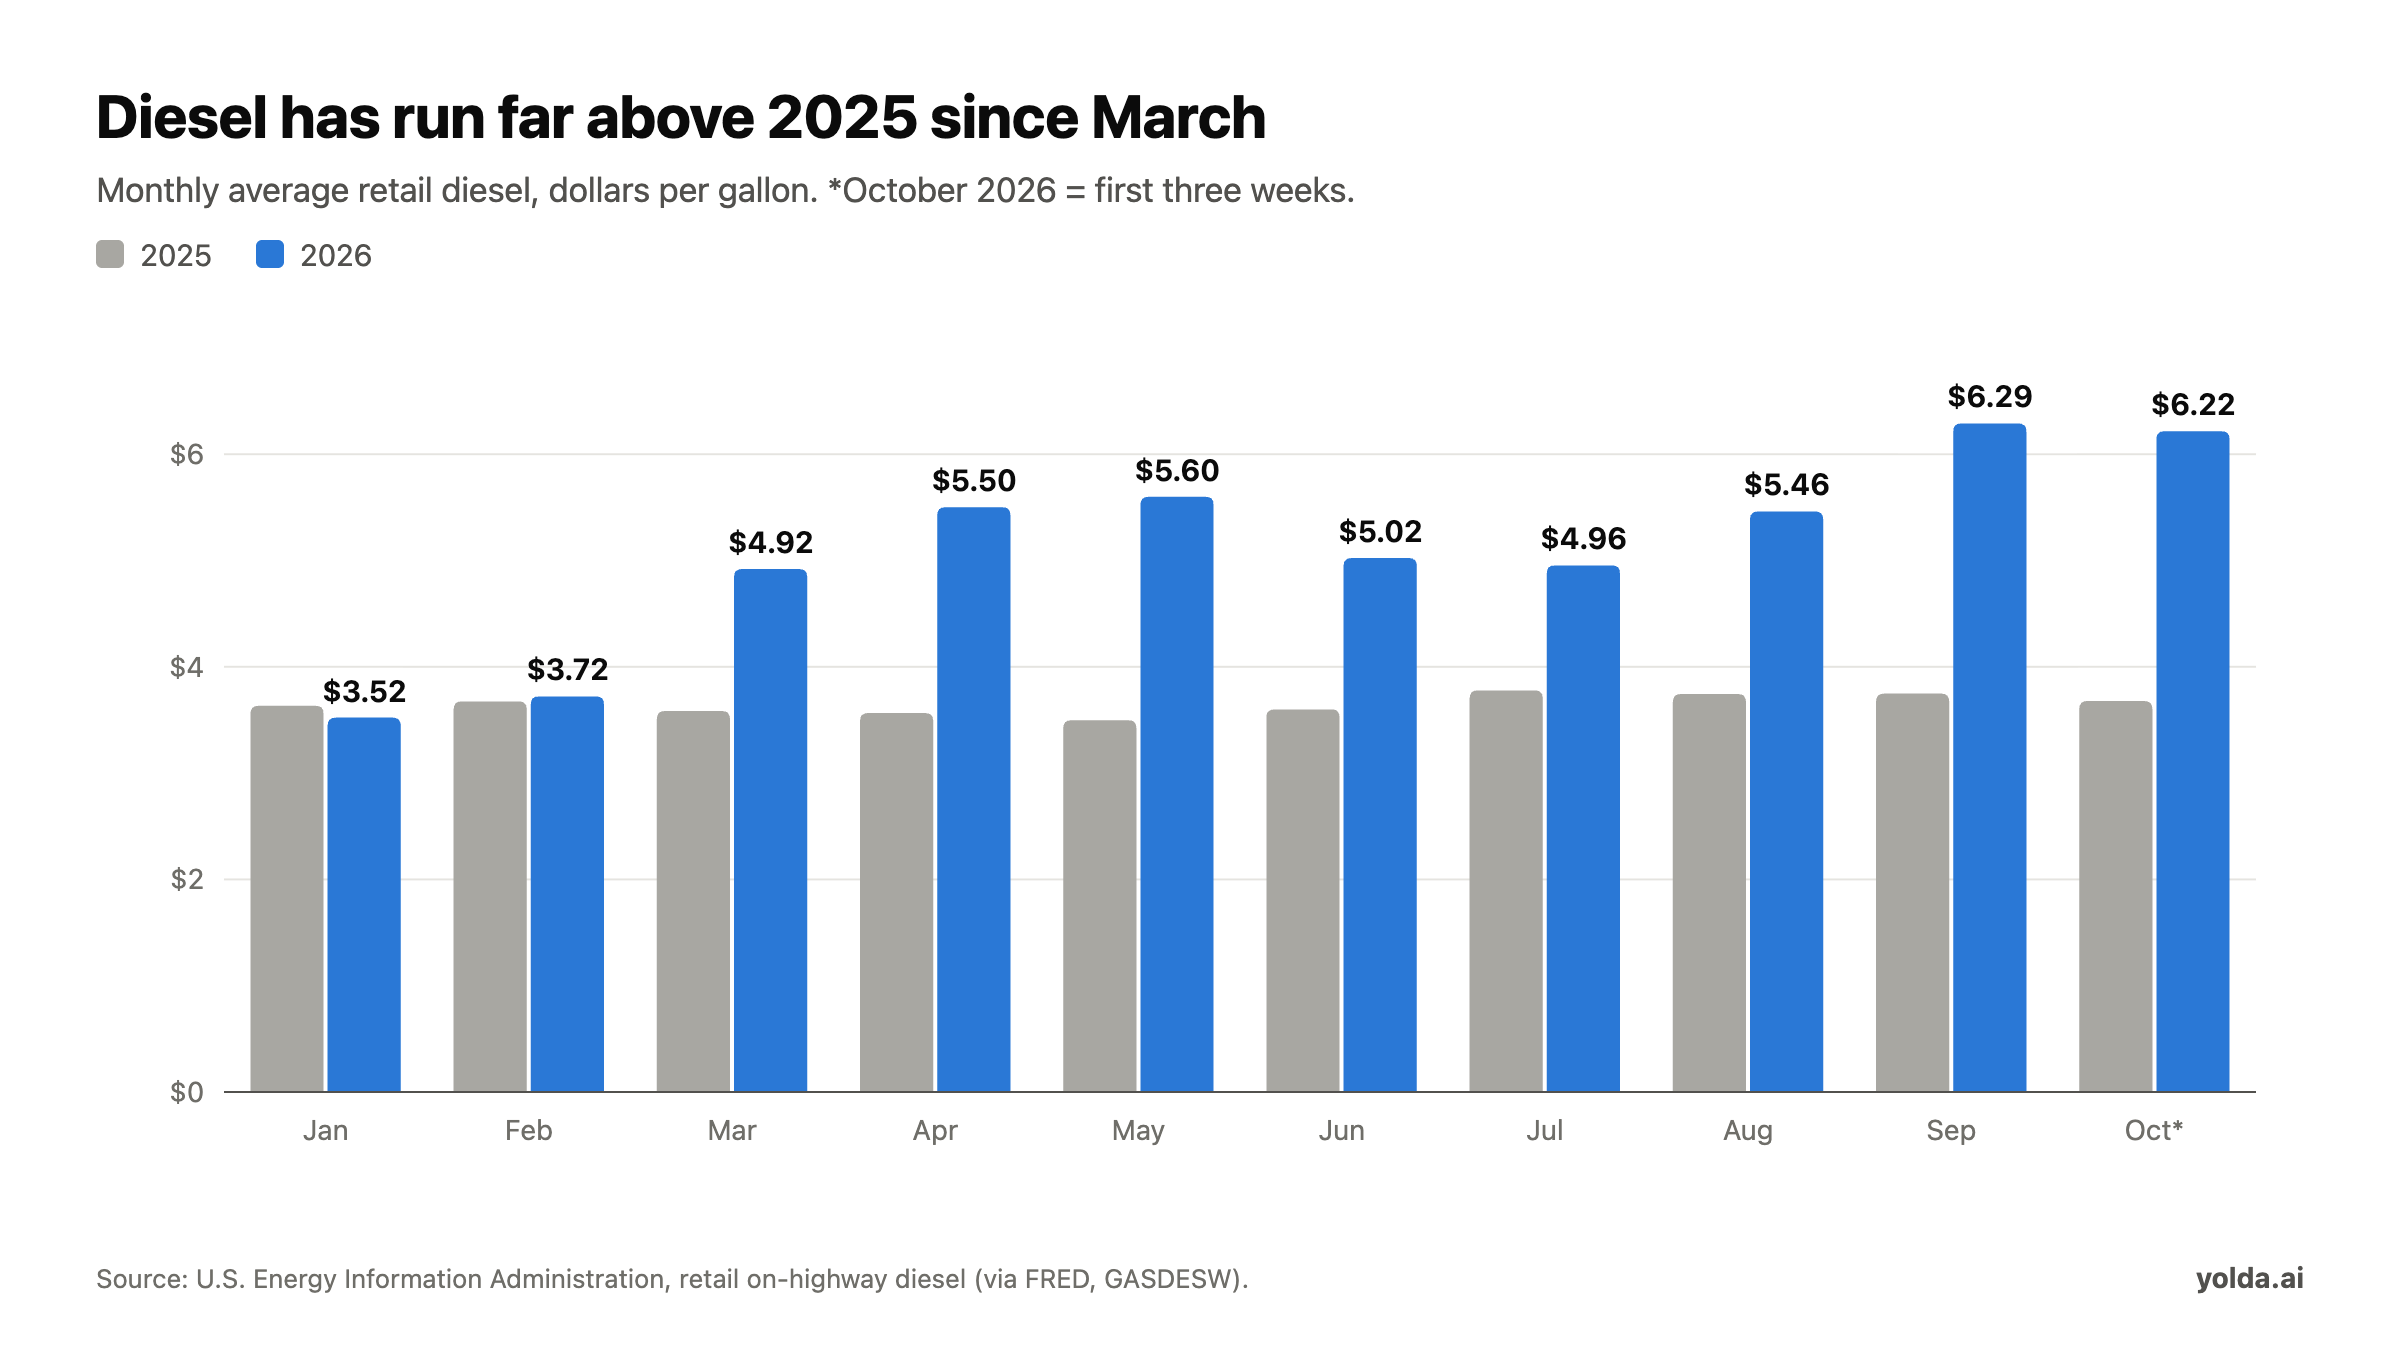
The jump started in March. Diesel averaged $3.72 a gallon in February 2026 and $4.92 in March, and the weekly price has not been back below $4.50 since the week of March 9. From January 5 to October 19, 2026, diesel averaged $5.10 a gallon, up 40% on the same weeks of 2025 ($3.65).
| Month | 2025 average | 2026 average |
|---|---|---|
| January | $3.63 | $3.52 |
| February | $3.67 | $3.72 |
| March | $3.58 | $4.92 |
| April | $3.57 | $5.50 |
| May | $3.50 | $5.60 |
| June | $3.60 | $5.02 |
| July | $3.78 | $4.96 |
| August | $3.74 | $5.46 |
| September | $3.75 | $6.29 |
| October (first three weeks of 2026) | $3.68 | $6.22 |
What a carrier actually pays depends heavily on where it buys.
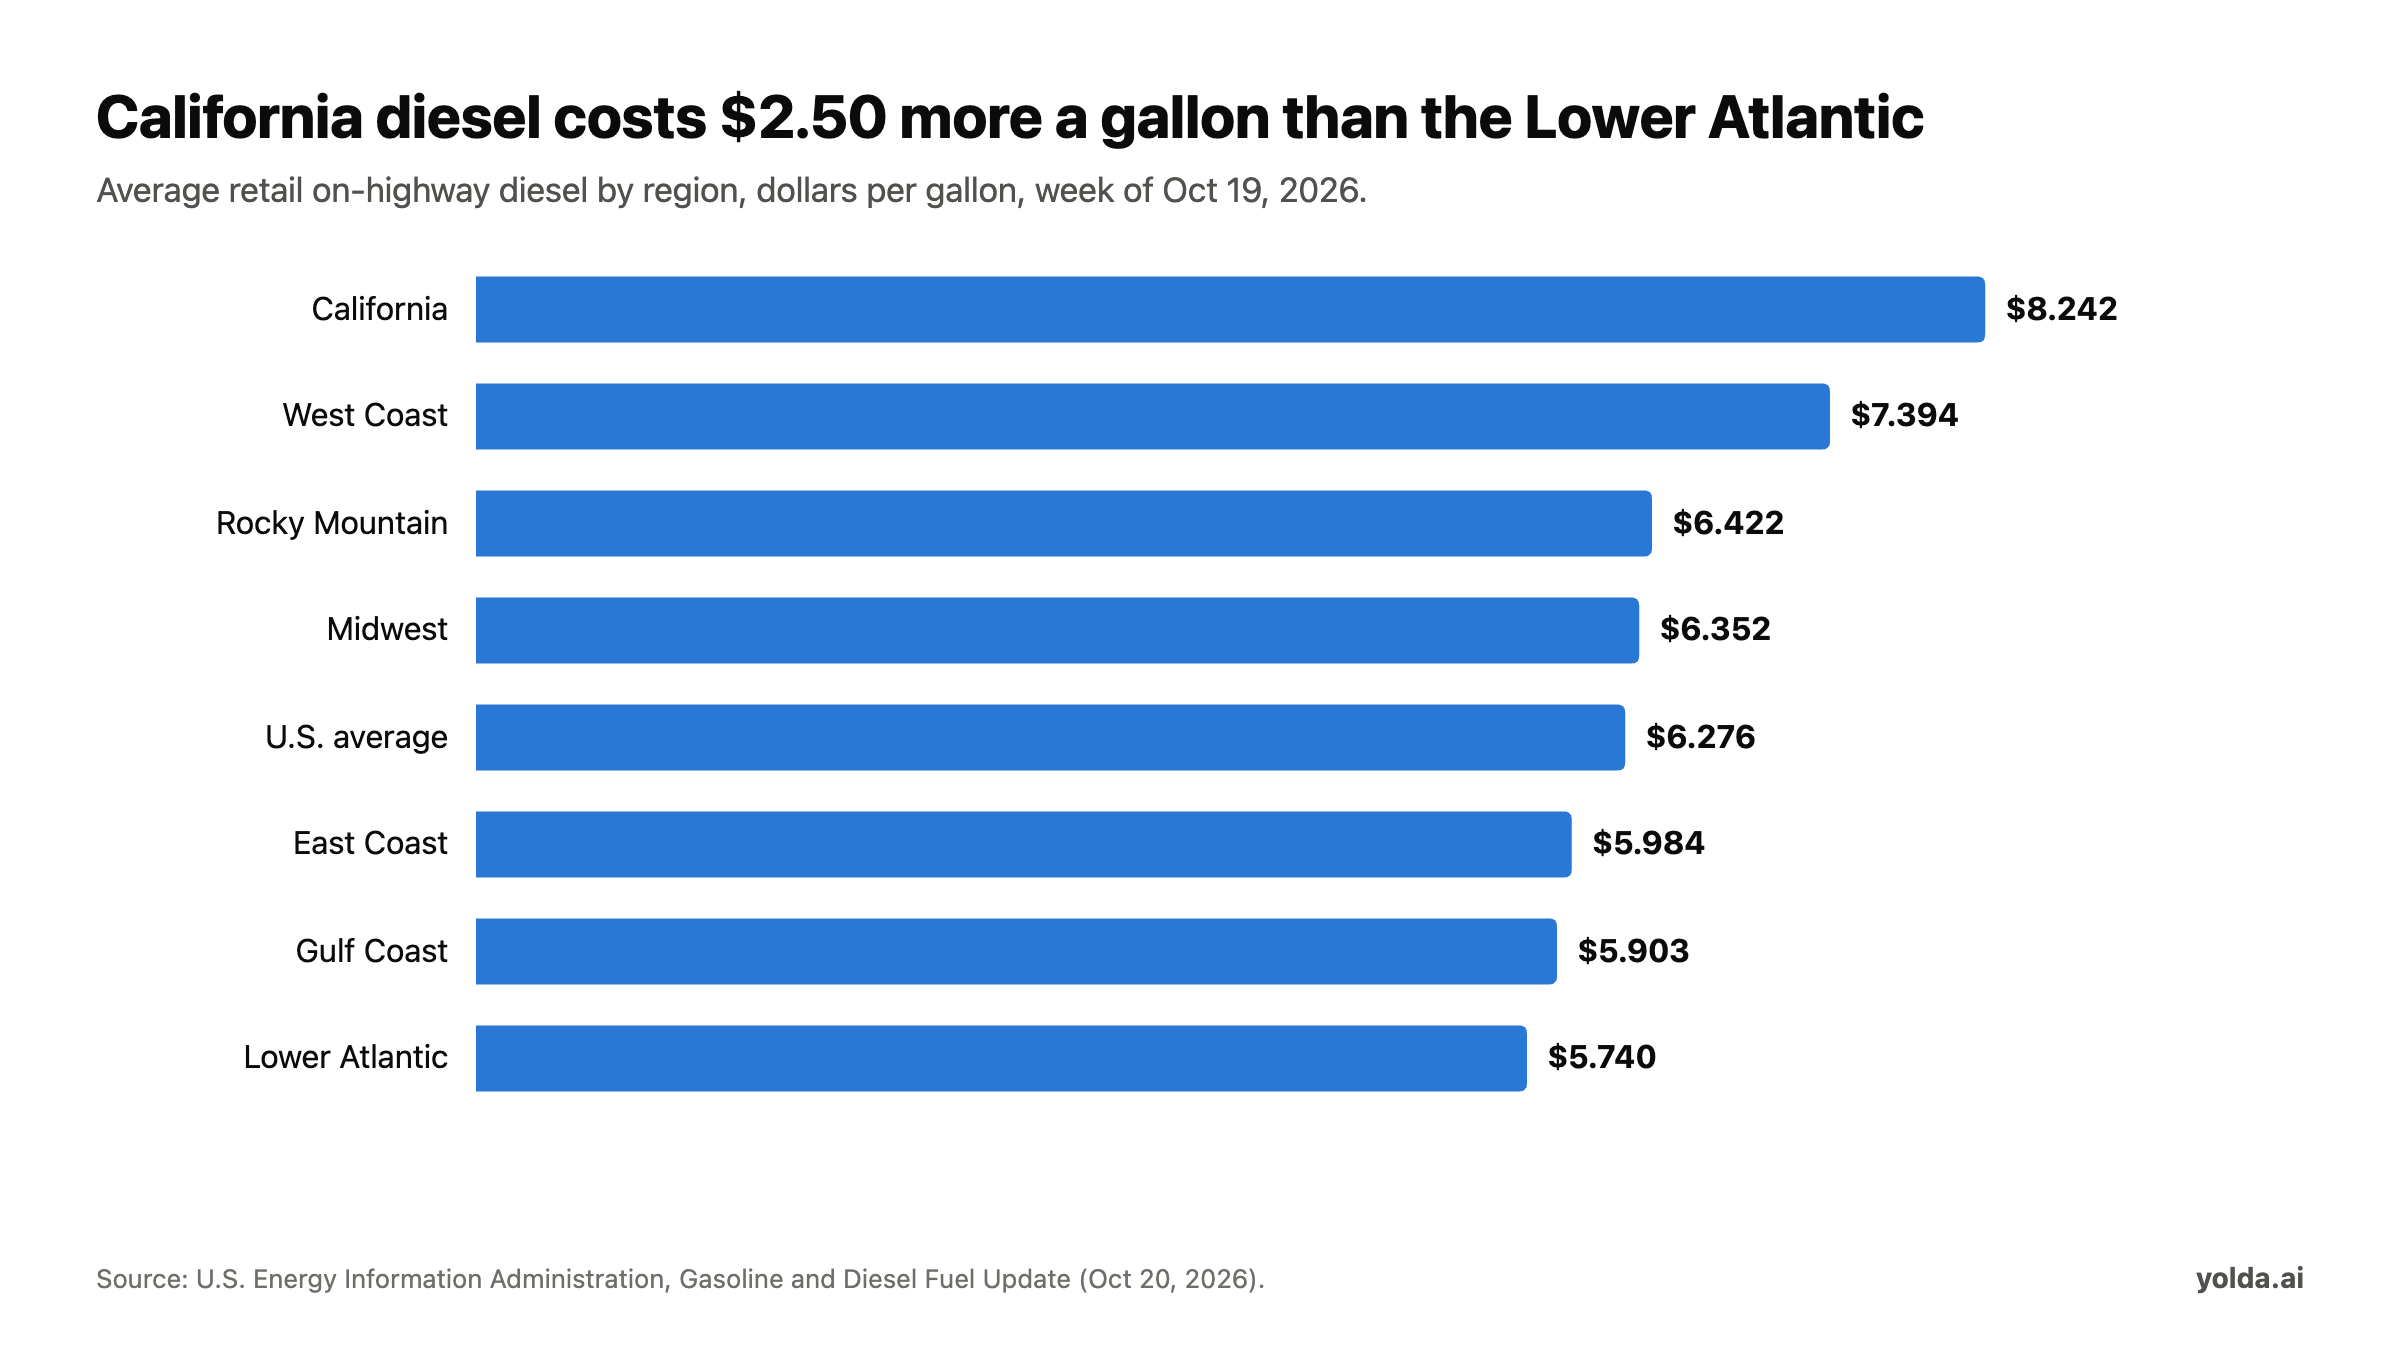
In the week of October 19, a gallon cost $8.242 in California and $5.740 in the Lower Atlantic states, a gap of about $2.50. Under IFTA you still owe fuel tax by the miles you drive in each state, so the saving from fueling in a cheaper region comes from the pre-tax price, not the tax. Our guide on tracking fuel purchases by state shows how to keep those records straight.
What diesel now costs per mile
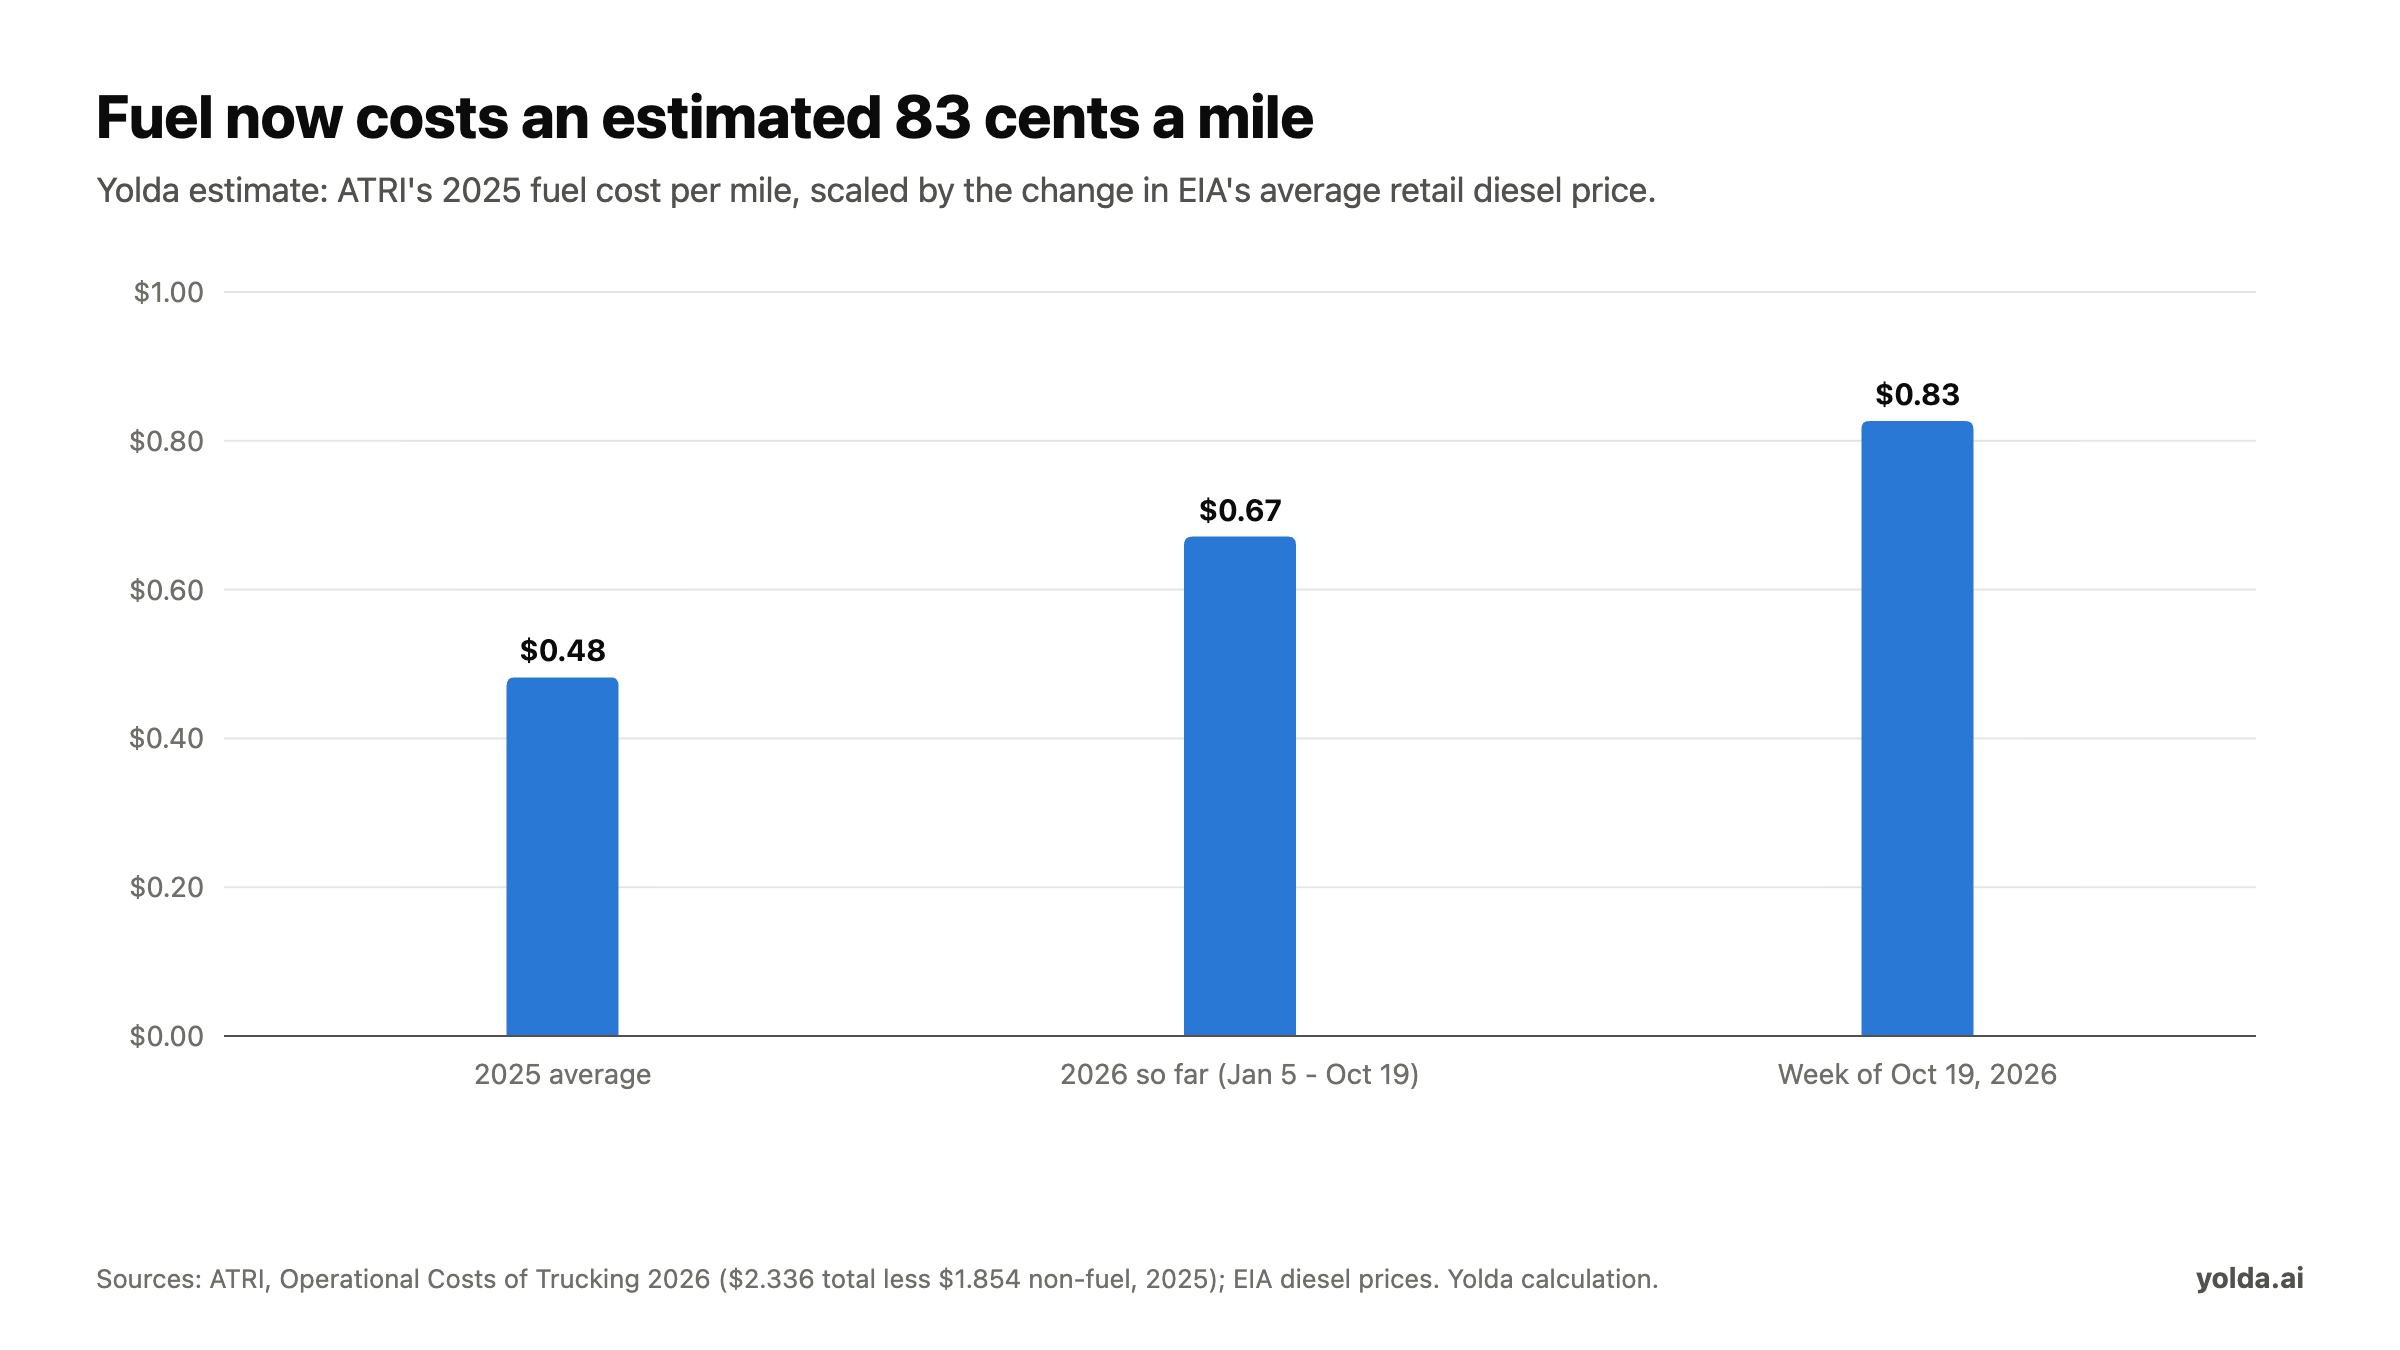
ATRI's 2026 Operational Costs of Trucking report put the average cost of running a truck in 2025 at $2.336 a mile, of which $1.854 was everything except fuel. That leaves about $0.482 a mile for fuel in 2025, when diesel averaged $3.66.
We scaled that fuel figure by the change in the pump price. The result, assuming the same fuel economy and fuel discounts as ATRI's 2025 fleets:
| Period | Average diesel | Estimated fuel cost per mile | Change per 100,000 miles vs 2025 |
|---|---|---|---|
| 2025 average | $3.66 | $0.48 | — |
| 2026 so far (Jan 5 to Oct 19) | $5.10 | $0.67 | +$18,900 |
| Week of Oct 19, 2026 | $6.28 | $0.83 | +$34,400 |
If non-fuel costs stayed at their 2025 level, today's diesel would put the all-in cost near $2.68 a mile. ATRI's preliminary first-quarter data suggests operating costs rose again in 2026, so treat that as a floor rather than a forecast. Your own number depends on your MPG and what you pay at the pump: run it in the free cost per mile calculator, and see how to calculate cost per mile for the full method.
Rates are up, and not only because of fuel
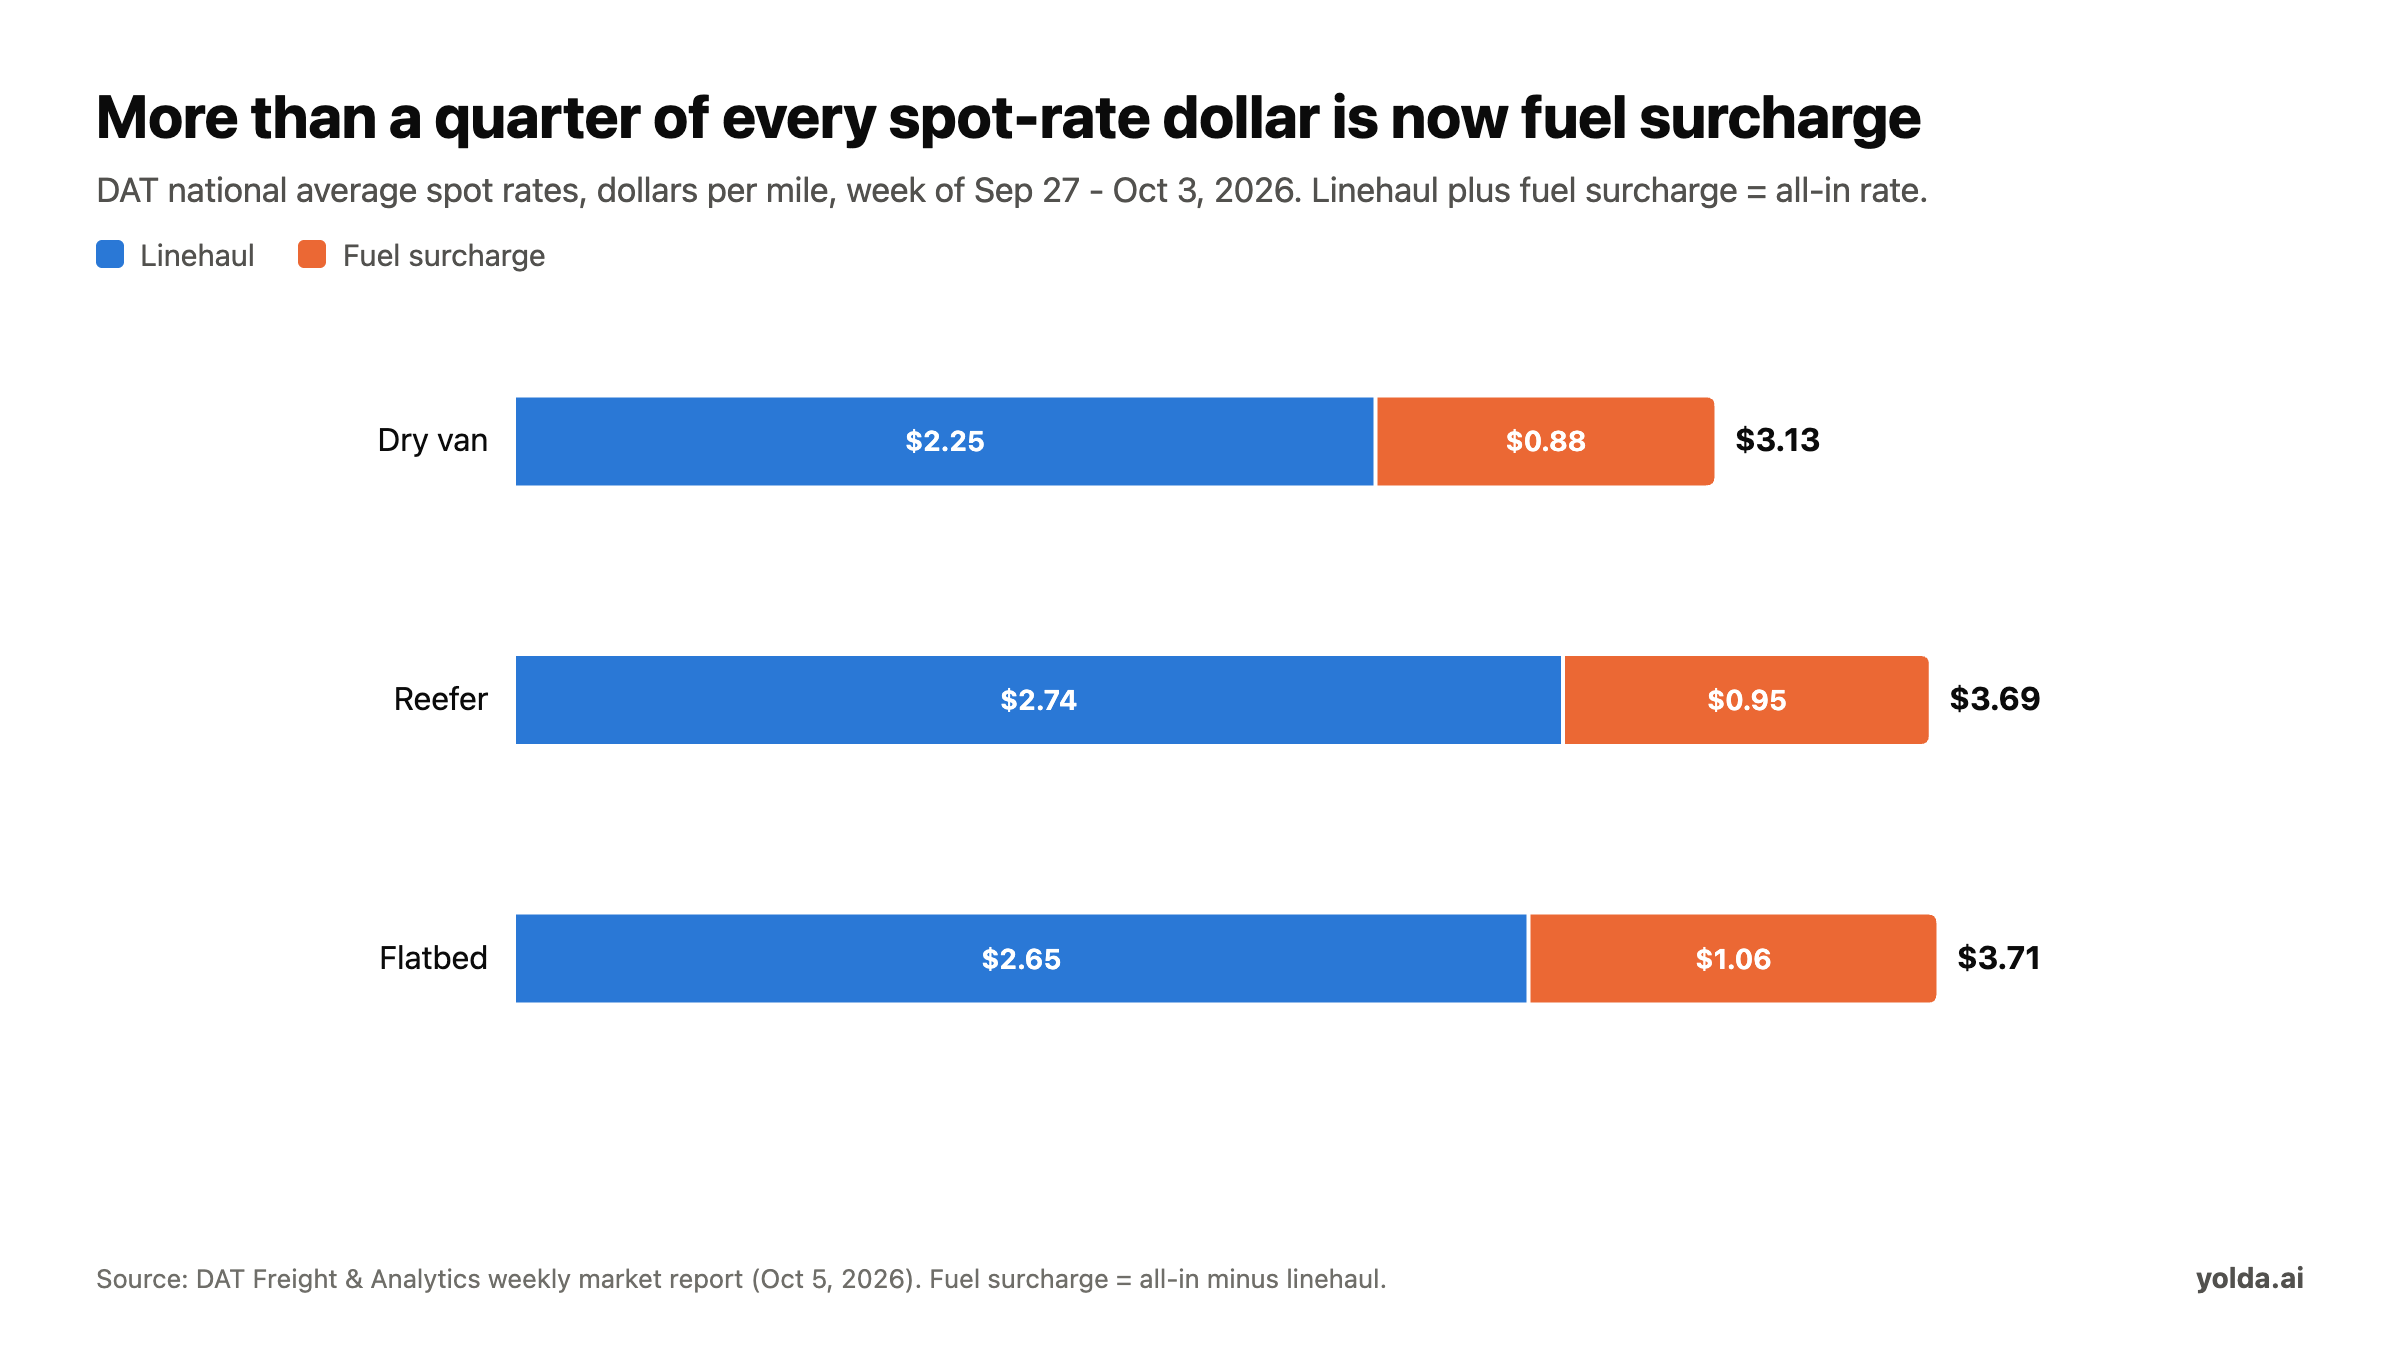
DAT's national spot rates for the week of September 27 to October 3, 2026:
| Equipment | Linehaul | Fuel surcharge | All-in | Linehaul vs a year earlier |
|---|---|---|---|---|
| Dry van | $2.25 | $0.88 | $3.13 | +34% |
| Reefer | $2.74 | $0.95 | $3.69 | +33% |
| Flatbed | $2.65 | $1.06 | $3.71 | +28% |
Fuel surcharge now makes up 26% to 29% of the all-in spot rate. On a dry van load that week, the surcharge of $0.88 a mile was close to our estimated fuel cost of about $0.84 a mile at that week's diesel price of $6.382. On the spot market, surcharges have roughly kept up with the pump.
Contract freight is moving too. The Cass Truckload Linehaul Index, which covers spot and contract rates and leaves fuel out, rose 10.1% from September 2025 to September 2026. FreightWaves reports it was the index's highest level in four years.
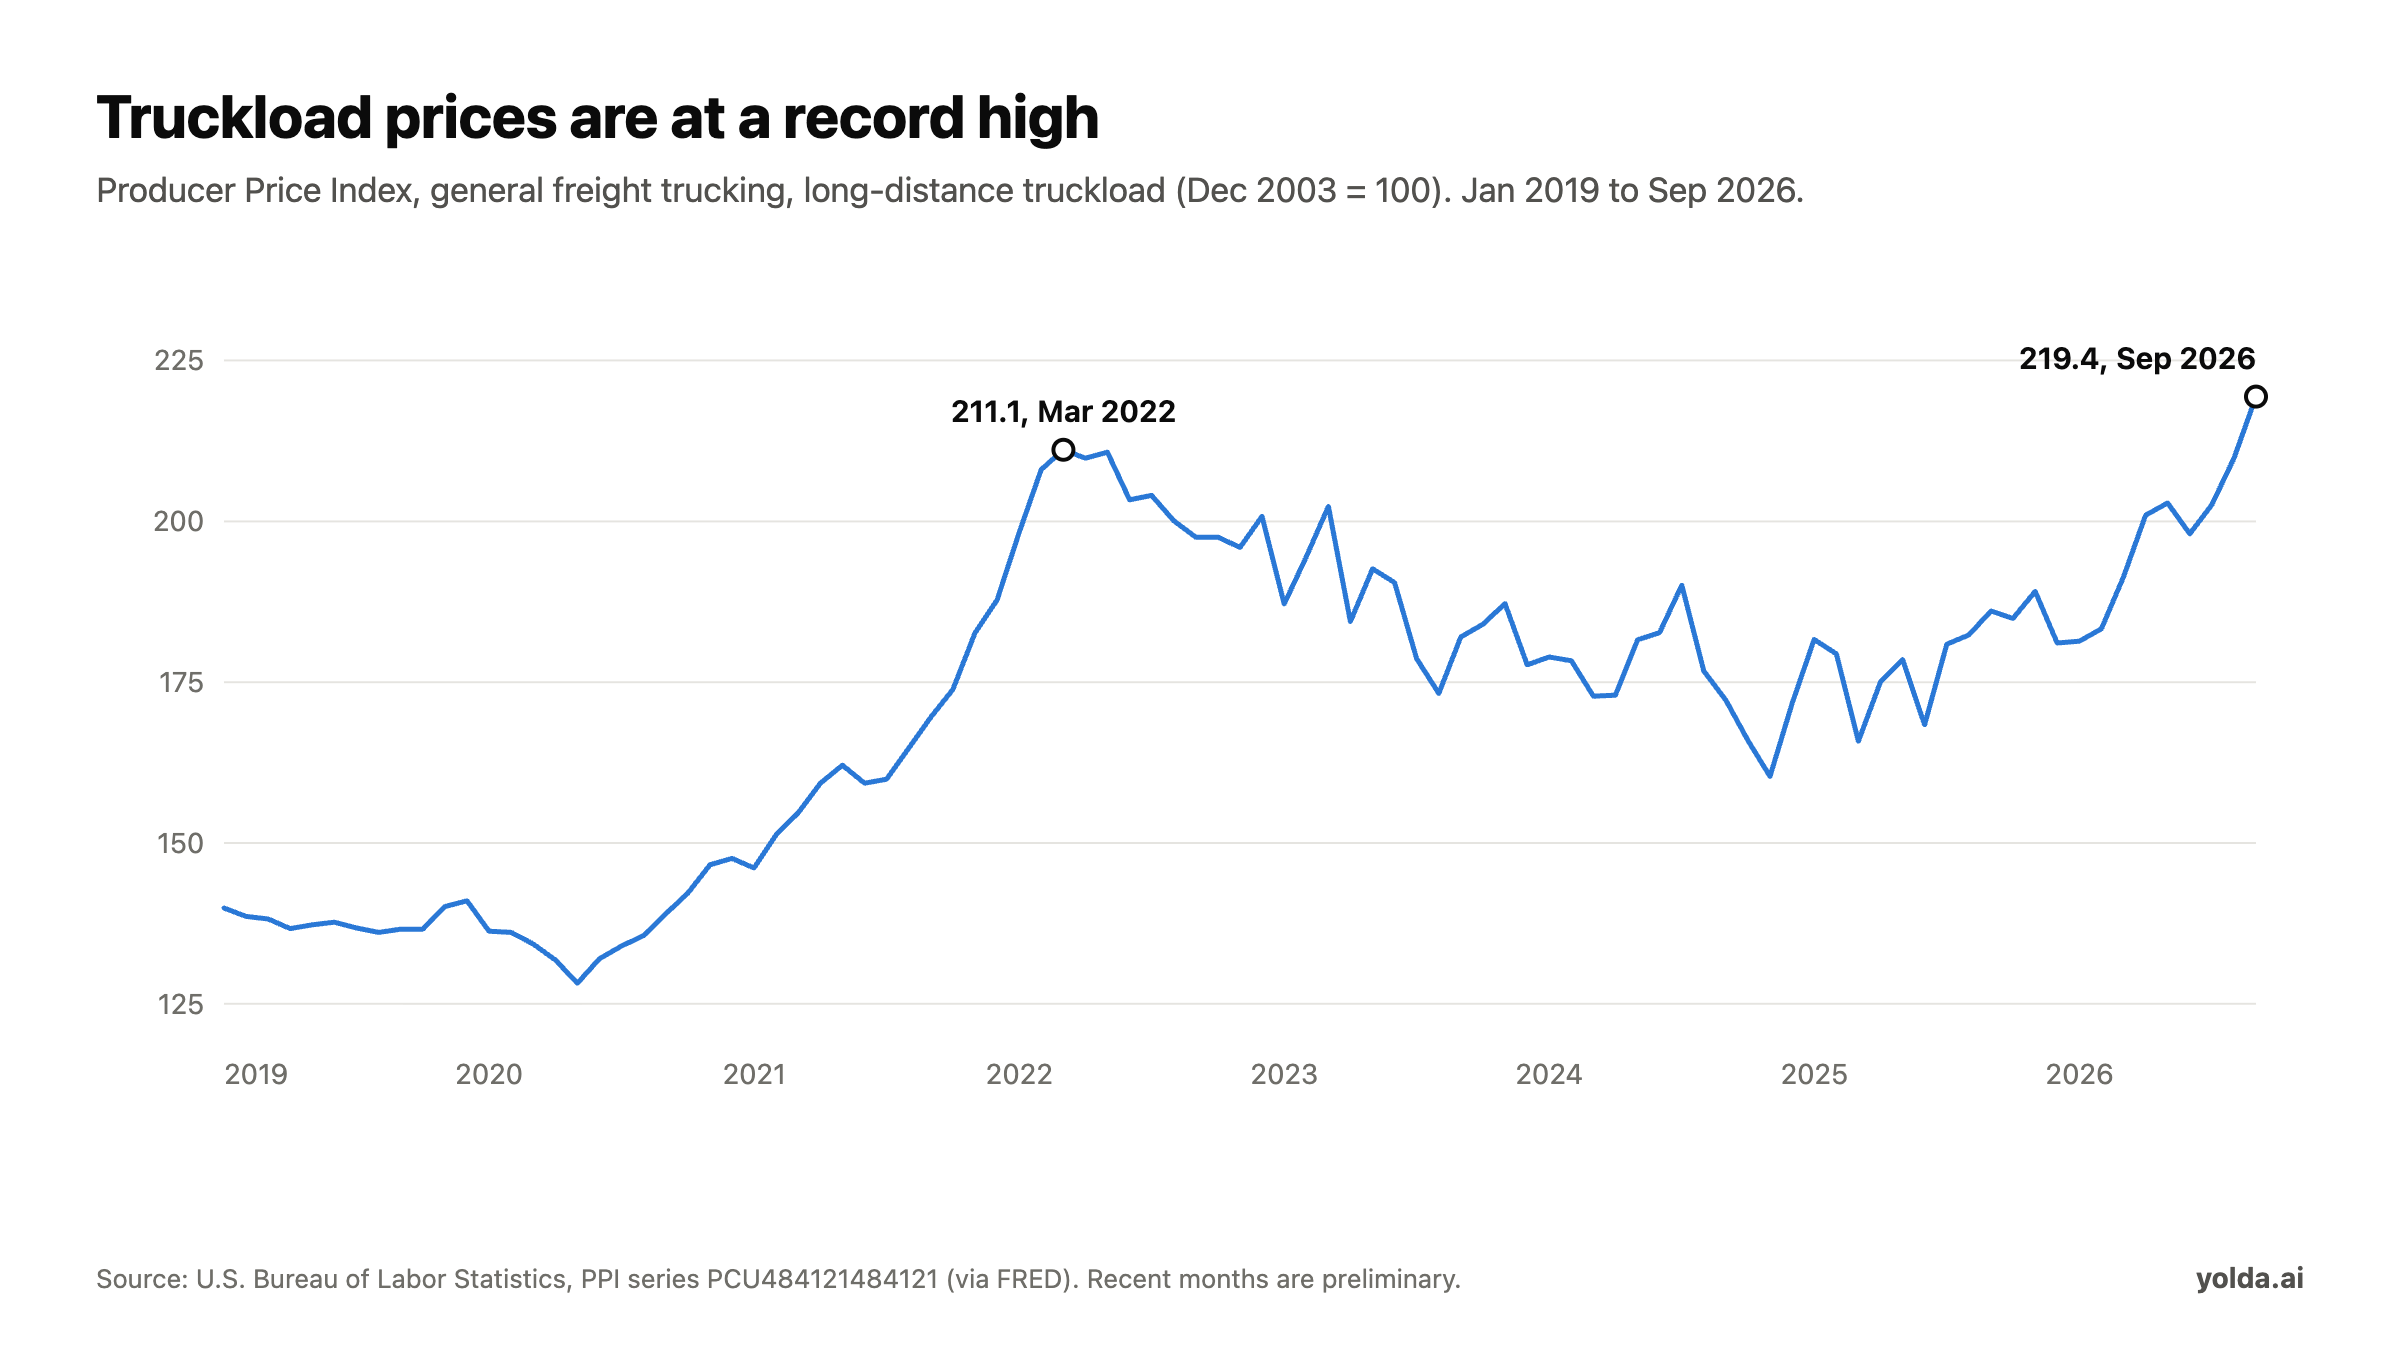
The Bureau of Labor Statistics' Producer Price Index for long-distance truckload reached 219.4 in September 2026 (December 2003 = 100), the highest in the series and 17.9% above September 2025. This index includes fuel surcharges. BLS revises recent months, so the latest readings are preliminary.
Shippers are paying far more for about the same freight
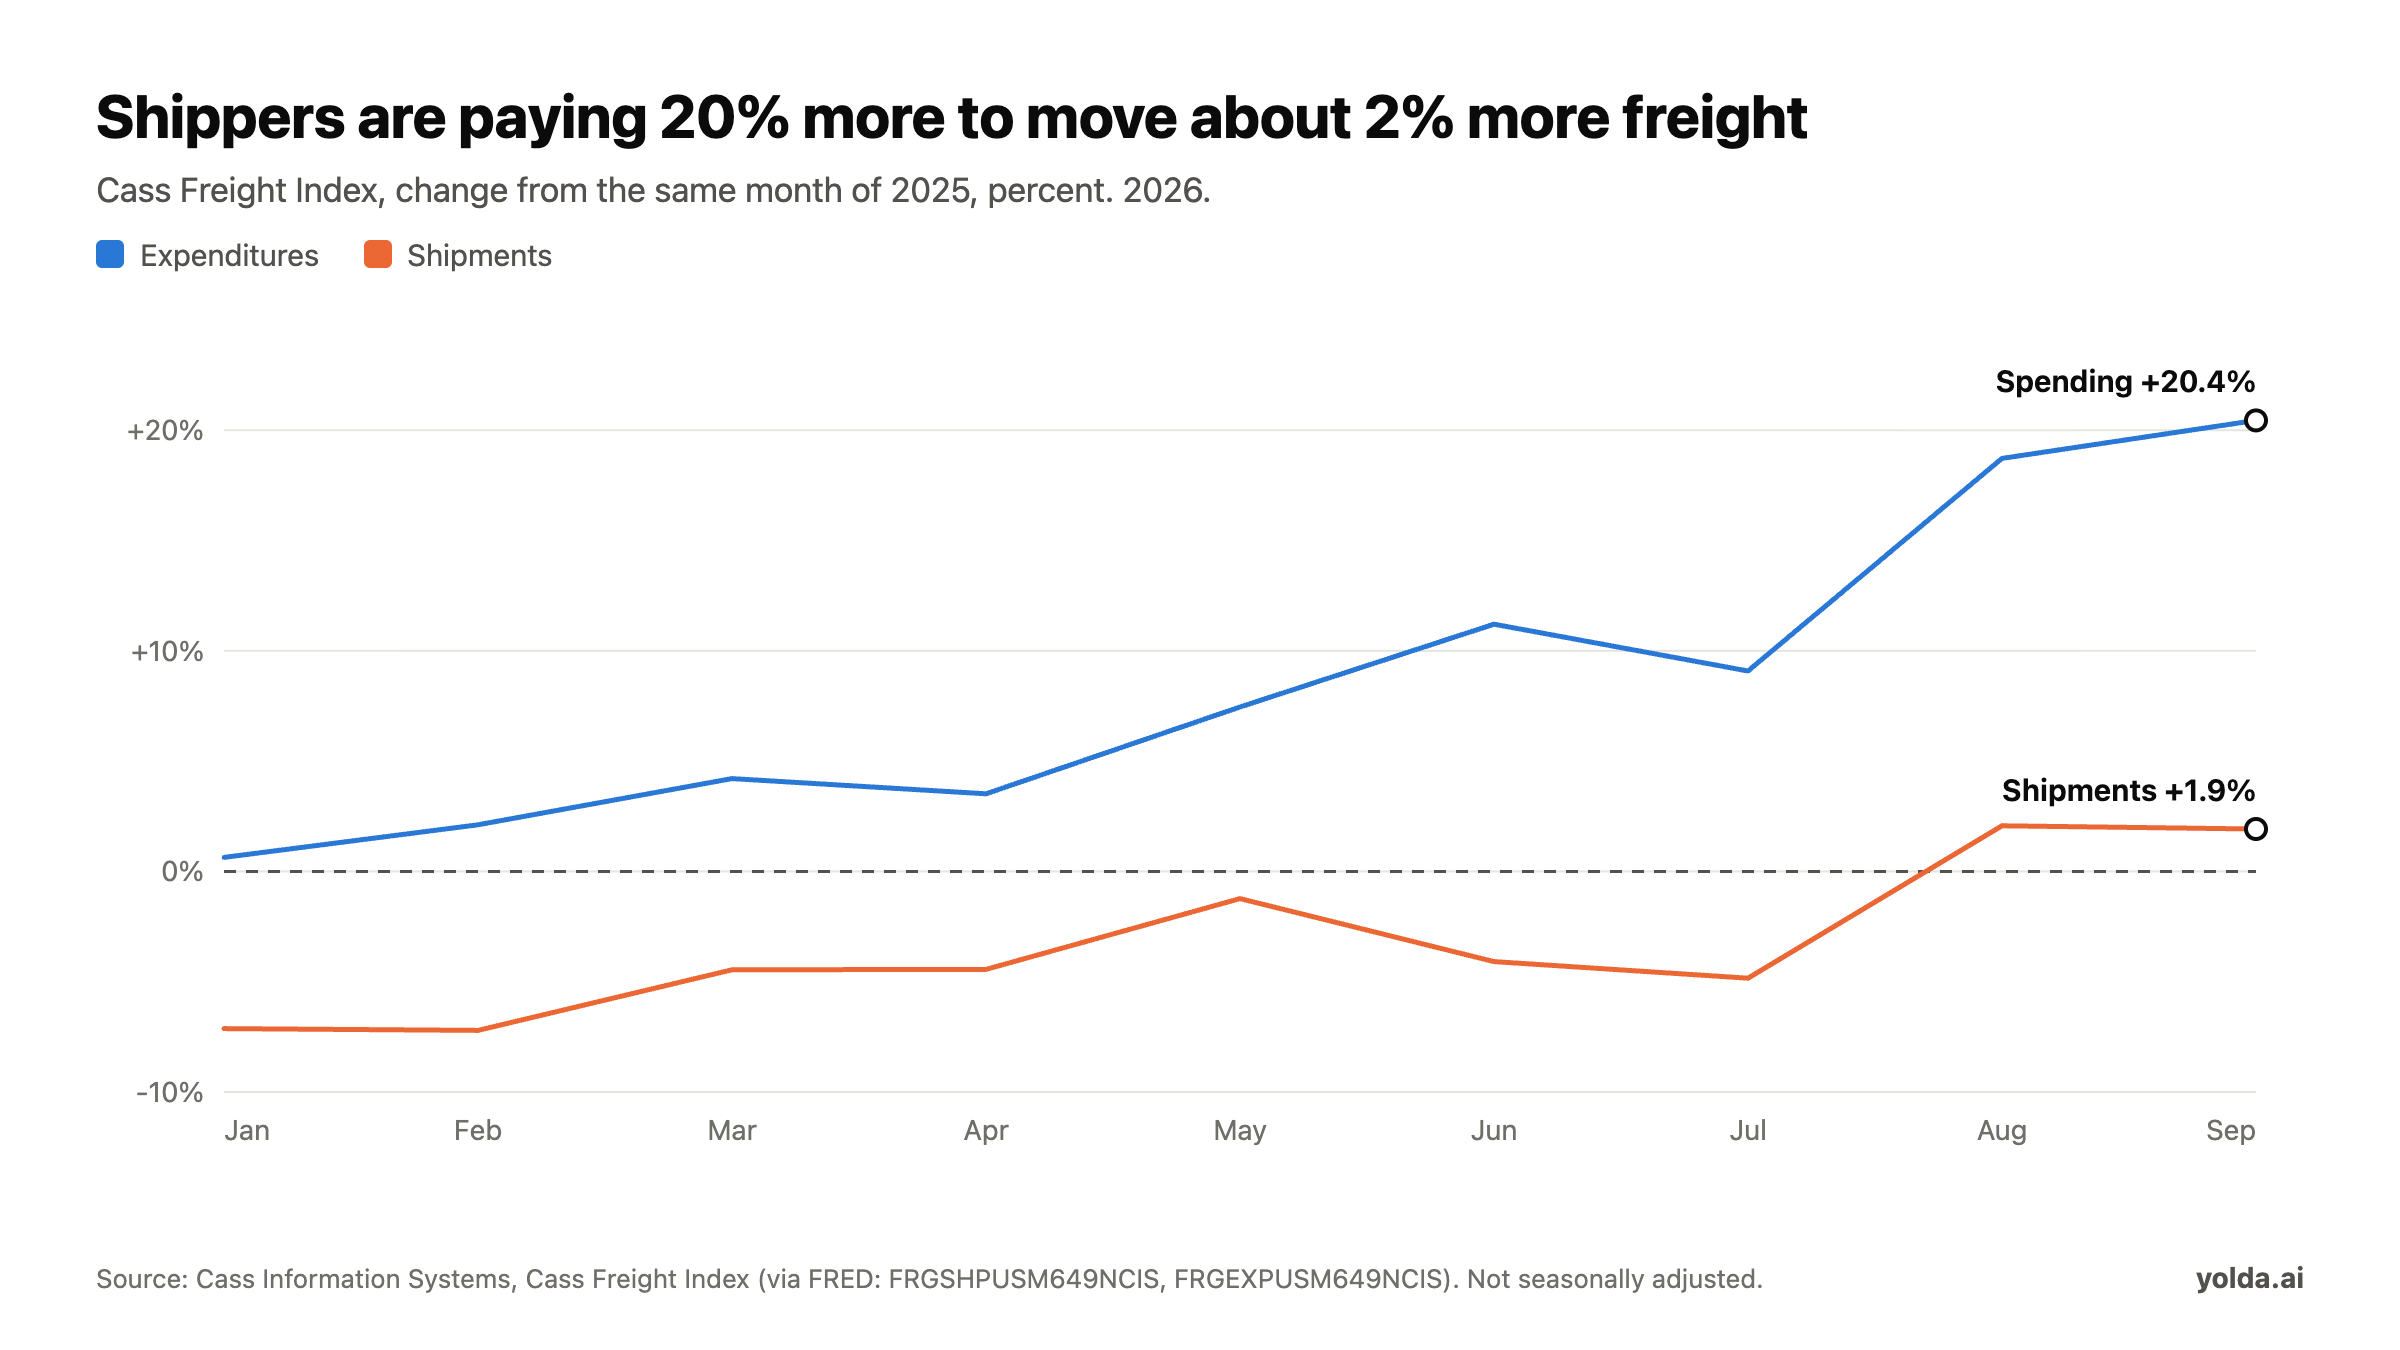
| Month (2026) | Shipments vs a year earlier | Expenditures vs a year earlier |
|---|---|---|
| January | -7.1% | +0.6% |
| February | -7.2% | +2.1% |
| March | -4.5% | +4.2% |
| April | -4.4% | +3.5% |
| May | -1.2% | +7.5% |
| June | -4.1% | +11.2% |
| July | -4.8% | +9.1% |
| August | +2.1% | +18.7% |
| September | +1.9% | +20.4% |
Freight volume has only just stopped shrinking. Cass shipments turned positive year over year in August, which FreightWaves notes ended 42 months of declines. Spending climbed much faster than volume all year, and the gap widened as diesel rose. Shippers are paying for fuel and for tighter capacity at the same time.
Fewer people on trucking payrolls
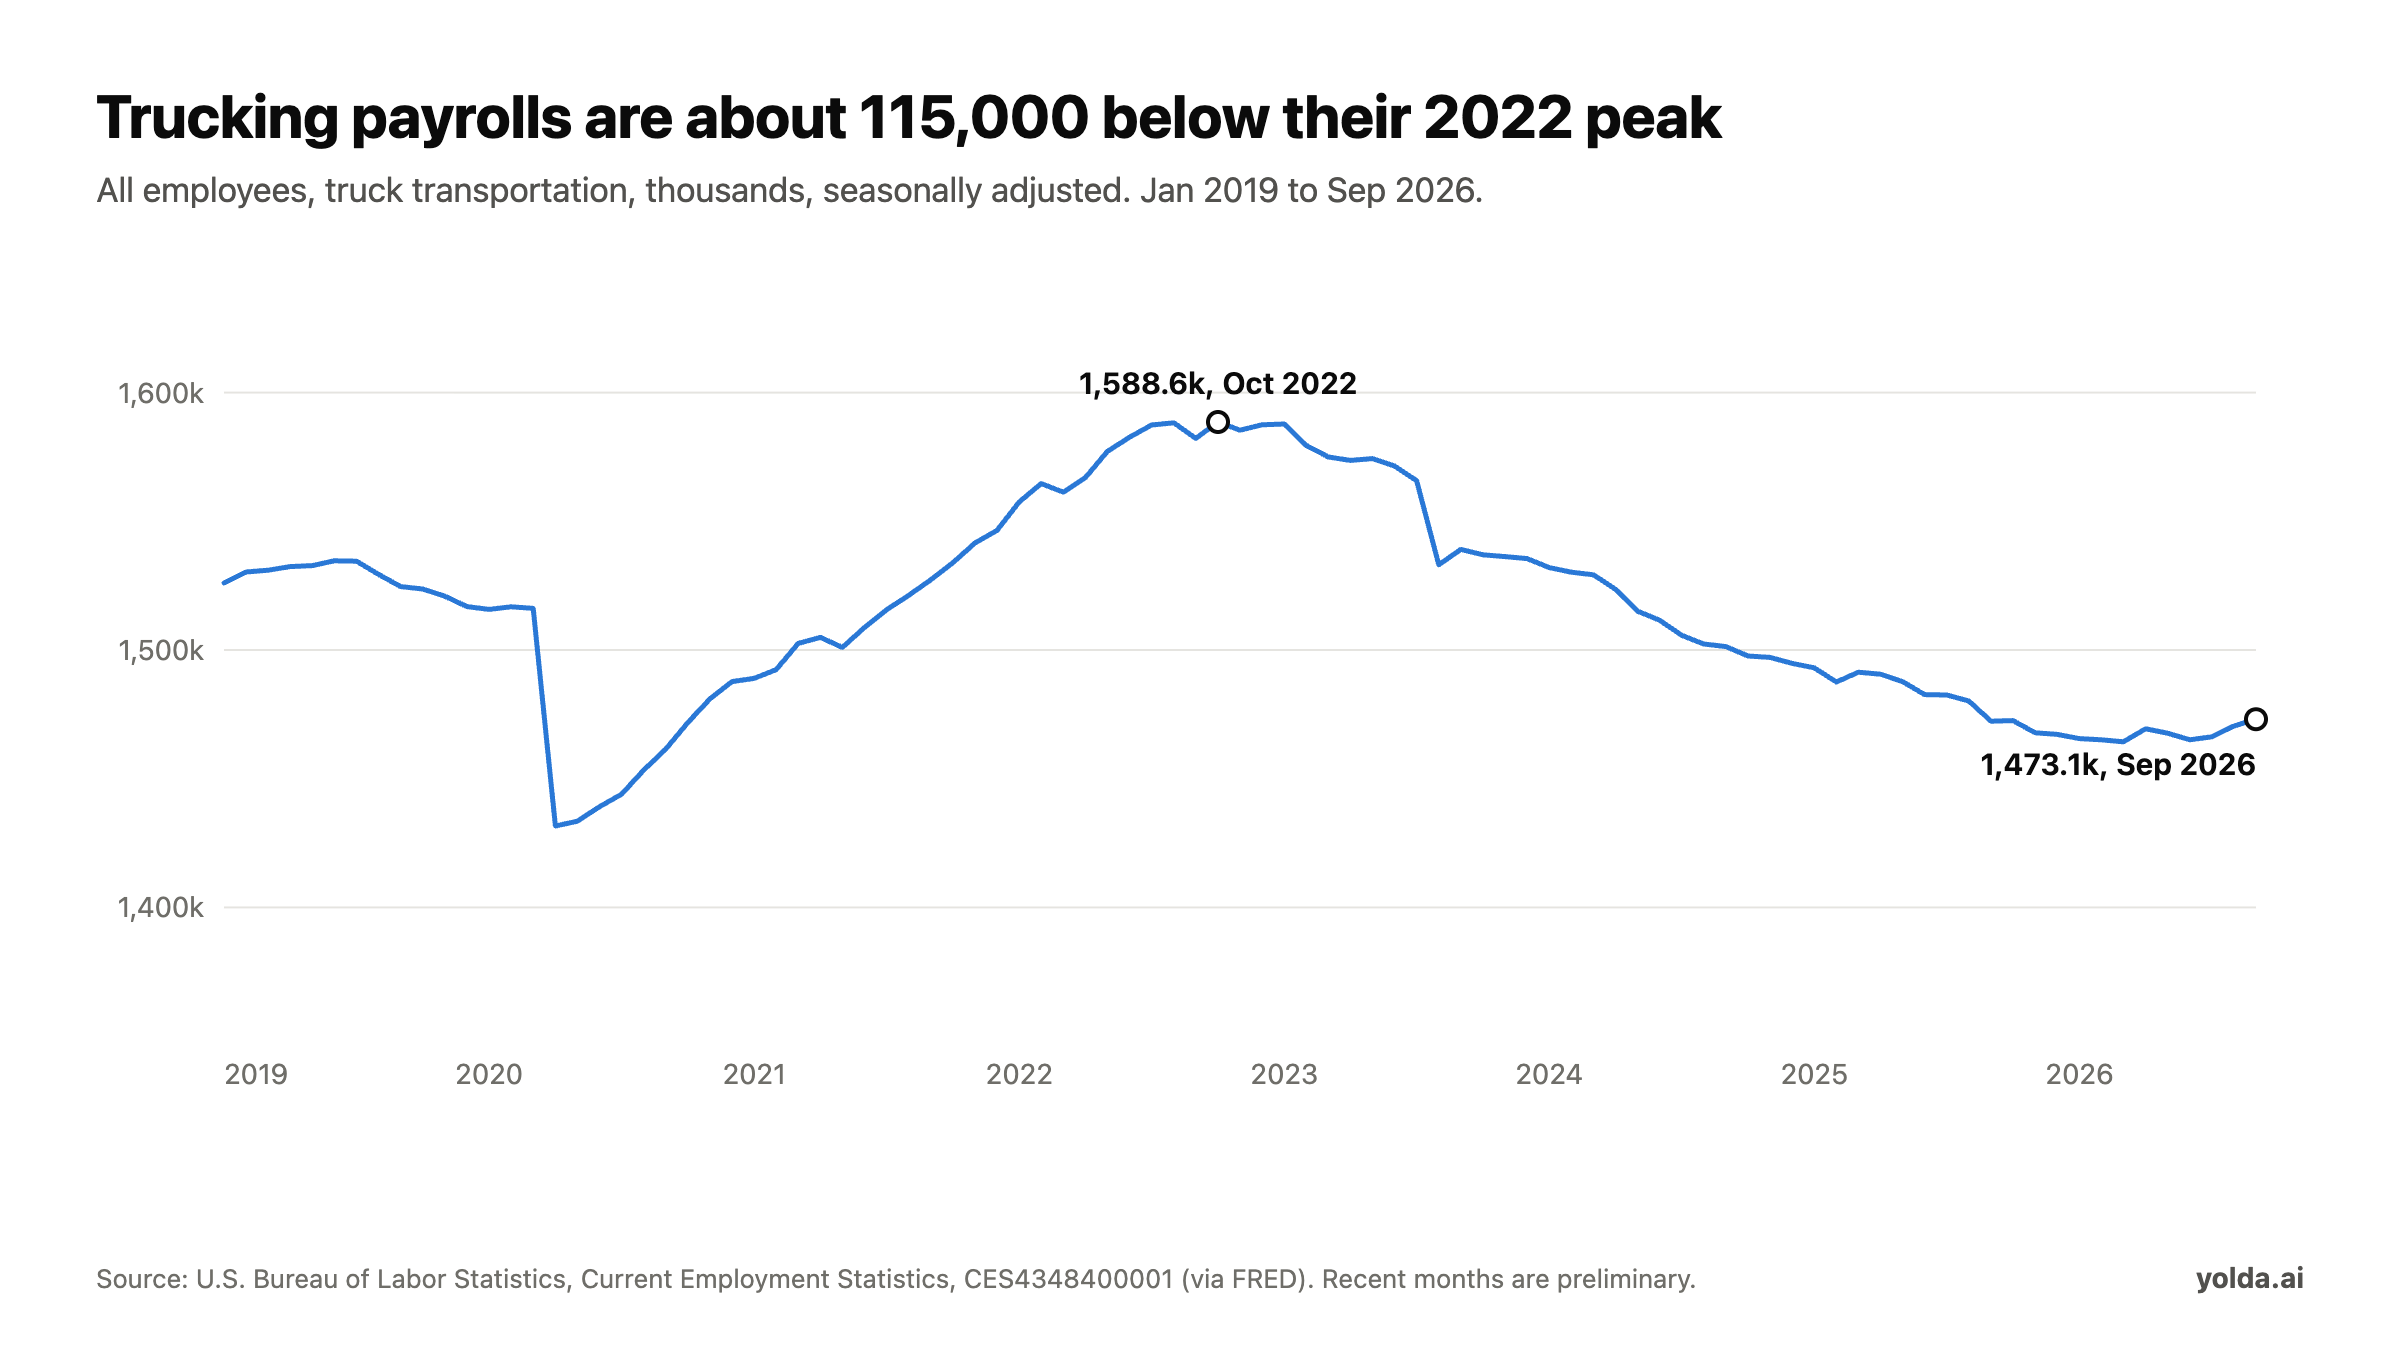
Truck transportation employed 1,473,100 people in September 2026 (seasonally adjusted, BLS). That is about 115,000 fewer than the October 2022 peak of 1,588,600, a drop of 7.3%, and only about 800 more than a year earlier. BLS counts payroll jobs, so owner-operators who are not on a payroll are not in this number.
Rising rates with flat payrolls fits a market where capacity, not demand, is setting prices. It is also why fuel jumped 17 places to become the No. 1 concern in the American Transportation Research Institute's 2026 Top Industry Issues survey, released October 18.
What this means for a small fleet
- Know your fuel cost per mile every week. Using the fuel economy implied by ATRI's 2025 figures, every 10 cents a gallon moves fuel cost by about 1.3 cents a mile. Keep fuel on its own line so you can update it without rebuilding the whole number.
- Check the surcharge on every contract lane. Spot surcharges have roughly tracked the pump. A contract surcharge table written when diesel was $3.60 may not, especially if it caps out or uses a high base price.
- See profit by lane, not only by month. When fuel takes more than a quarter of the rate, a lane that paid in 2025 can quietly lose money now. Yolda's accounting shows profit per truck and per lane from the loads, invoices and expenses you already enter, so the losing lanes show up before the month closes.
- Plan fuel stops by region. With a $2.50 spread between California and the Lower Atlantic, where you fill up matters. Keep every receipt by state for IFTA.
Methodology and sources
All data was retrieved on October 24, 2026. Figures are national averages and will differ from any single fleet's numbers.
- Diesel prices: U.S. Energy Information Administration, weekly U.S. retail on-highway diesel price, including taxes (FRED series GASDESW). Regional prices: EIA Gasoline and Diesel Fuel Update, week of October 19, 2026. Monthly figures are averages of the weekly readings. "All-time high" means the highest weekly figure since the series began in 1994, not adjusted for inflation.
- Fuel cost per mile (Yolda estimate): ATRI's 2025 average operating cost ($2.336 a mile) minus its non-fuel cost ($1.854) gives $0.482 a mile for fuel (ATRI, July 15, 2026). We multiplied that by the ratio of each period's average EIA diesel price to the 2025 average ($3.66). This assumes 2025 fuel economy and fuel discounts.
- Spot rates: DAT Freight & Analytics weekly market report for September 27 to October 3, 2026, as published by AJOT. Fuel surcharge equals the all-in rate minus the linehaul rate.
- Cass Freight Index: shipments and expenditures, not seasonally adjusted (FRED series FRGSHPUSM649NCIS and FRGEXPUSM649NCIS). Truckload Linehaul Index change as reported by FreightWaves, October 13, 2026.
- Truckload prices: BLS Producer Price Index, general freight trucking, long-distance truckload (FRED series PCU484121484121). Recent months are preliminary.
- Employment: BLS Current Employment Statistics, all employees, truck transportation, seasonally adjusted (FRED series CES4348400001). Recent months are preliminary.
- Top industry issues: ATRI 2026 Top Industry Issues report, released October 18, 2026, as reported by ACT News.
How to cite this report: Yolda, "Trucking Industry Statistics, Q3 2026: Diesel Hits a Record," October 2026, https://yolda.ai/blog/trucking-industry-statistics-q3-2026.


