
Quick answer: Your true cost per mile is fixed costs per mile plus variable costs per mile, calculated separately so a diesel spike only moves one number instead of forcing you to rebuild the whole thing. Most fleets get this wrong by recalculating everything every time fuel jumps, which makes rates and driver pay bounce around and erodes trust. The fix is to split fixed from variable, price fuel off a rolling average instead of the spot price, and rebuild only the fuel line when prices move.
Key takeaways
- Fixed costs (truck payment, insurance, licensing, ELD fees) stay the same whether you drive 2,000 miles a month or 12,000 — calculate these once a quarter, not daily.
- Variable costs (fuel, tires, maintenance, driver pay) change with miles and conditions — fuel is the most volatile line and deserves its own recalculation schedule.
- A rolling 4- to 6-week average diesel price, not the price you paid this morning, should drive your cost-per-mile fuel line and your fuel surcharge.
- Rebuilding your whole cost-per-mile figure every time diesel moves a few cents is how fleets end up underpricing loads they already booked.
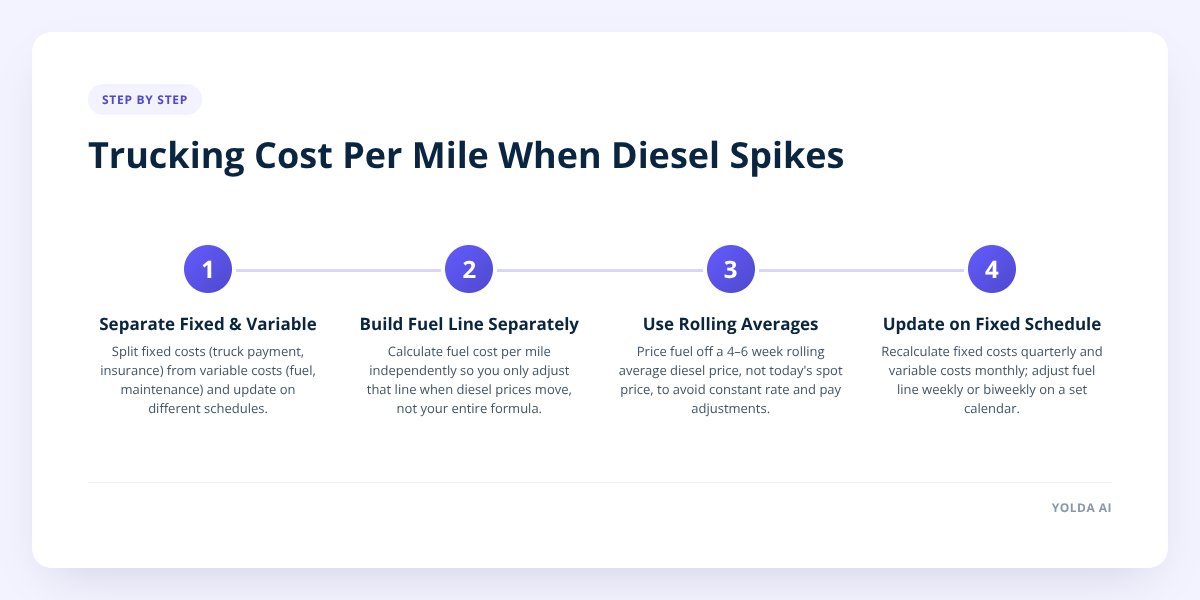
Why Cost-Per-Mile Math Breaks When Fuel Spikes
Most fleets break their own cost-per-mile number by recalculating it too often, not too rarely. When diesel jumps 30 cents in a week, the instinct is to redo the whole formula — but if your equipment costs, insurance, and driver base pay haven't changed, you're rebuilding 80% of a number that didn't move, just to update the 20% that did.
That churn causes two real problems. First, rate quotes start drifting day to day, which confuses customers and makes you look disorganized on a bid. Second, if driver pay is tied loosely to "current" cost per mile, drivers see their per-mile rate change constantly, and nobody can explain why.
The pattern shows up clearly whenever diesel prices surge, which is exactly when fleets most need a stable number, not a moving target. A cost-per-mile model built correctly doesn't need a daily refresh. It needs two separate buckets, updated on two separate schedules.
Step 1: Separate Fixed Costs From Variable Costs
Fixed costs are what you pay regardless of how many miles you run this month. Variable costs scale with miles driven, and fuel is the biggest and most unpredictable one.
Fixed costs typically include:
- Truck and trailer payments or lease costs
- Insurance premiums (liability, cargo, physical damage)
- Licensing, permits, and registration fees
- ELD and software subscriptions
- Office overhead and administrative salaries
Variable costs typically include:
- Fuel
- Tires
- Routine maintenance and repairs
- Driver pay (whether per-mile, percentage, or hourly)
- Tolls
To turn fixed costs into a per-mile figure, add up your total fixed costs for a period — a quarter works well — and divide by total miles driven in that same period. If your fixed costs run $9,000 a month across equipment, insurance, and permits, and the truck covers 9,500 miles, your fixed cost per mile is roughly 95 cents. That number barely moves month to month unless you add equipment or your insurance renews at a different rate.
Variable costs get calculated the same way, but each component needs its own line because they move at different speeds. Maintenance creeps up slowly. Driver pay is usually set by contract. Fuel can swing by double digits in a single month — which is exactly why it needs to be isolated instead of blended into one average "cost per mile" number that becomes stale the moment diesel moves.
Step 2: Build the Fuel Line Separately From Everything Else
Fuel deserves its own formula because it's the only major cost that can change meaningfully week to week. The basic math: divide your truck's average miles per gallon into the price per gallon you're paying, and that gives you fuel cost per mile.
A truck averaging 6.5 miles per gallon paying $3.85 a gallon runs about 59 cents a mile in fuel. If diesel climbs to $4.20, that same truck is now at roughly 65 cents a mile — a 6-cent jump that, spread across 100,000 annual miles, is $6,000 in margin that either gets passed through or eaten.
This is the one line in your cost-per-mile model that should get recalculated more often than the rest — but "more often" doesn't mean every single day. It means on a set schedule you control, not every time the price board at the truck stop changes.
Don't skip this: if your fuel cost per mile isn't broken out as its own line, you can't tell whether a lane is unprofitable because of diesel or because of something else entirely — bad dispatching, excessive deadhead, or a driver running under spec'd MPG. Blending fuel into one average cost-per-mile number hides the real problem.
Step 3: Use a Rolling Average Instead of the Spot Price
Price your cost-per-mile fuel line off a rolling average of the last several weeks, not the price you paid filling up this morning. The U.S. Energy Information Administration publishes a weekly average retail diesel price for the country and by region, and that published average is a far steadier reference point than any single truck stop's board price on any single day.
Here's the real-world math. Say diesel prices over six weeks looked like this at the pump:
| Week | Price per gallon |
|---|---|
| 1 | $3.78 |
| 2 | $3.85 |
| 3 | $4.10 |
| 4 | $4.22 |
| 5 | $4.05 |
| 6 | $3.95 |
The spot price on any given day ranged from $3.78 to $4.22 — a 44-cent swing. But the 6-week rolling average sits at $3.99. If you'd repriced your cost-per-mile fuel line every time the spot price moved, you'd have adjusted rates and driver pay five separate times in six weeks. Using the rolling average, you adjust once, and your number reflects where prices actually are, not where they were this morning.
A 4-week rolling average reacts faster to real trends; a 6-week average smooths out more noise but lags a true sustained spike by a bit longer. Either works — the point is picking one window and sticking to it, so your rate quotes and driver pay don't whipsaw every time the board price changes. We covered the full mechanics of this in Calculate Trucking Cost Per Mile.
Step 4: Tie the Model to Driver Pay and Customer Rates
Driver pay and customer quotes should reference the same rolling average you use internally — never the spot price — so nobody is negotiating off a number that's already stale by the time the truck rolls. If you're running a flat per-mile rate for drivers, build in a fuel adjustment clause that references your rolling average and only triggers above a defined threshold, say a move of 15 cents or more from the baseline.
This does two things. It protects driver pay from constant recalculation over minor day-to-day noise, and it protects your margin from drivers getting a stale, underpriced rate during a sustained spike. We walked through how to structure that trigger in How to Structure Driver Pay During Fuel Price Swings.
On the customer side, your rate quotes should carry a fuel surcharge tied to the same published index — many carriers reference the EIA's weekly average directly in their surcharge tables. That keeps your quoted rate defensible: you can point to a public number instead of saying "fuel went up, so the price did too."
The place this usually breaks down is mid-contract, when a lane was quoted months ago and diesel has since moved well past the original assumption. If you're staring down that exact situation right now, Recalculating Cost Per Mile When Diesel Prices Spike covers how to reprice without blowing up a standing customer relationship.
Step 5: Set a Recalculation Schedule and Stick to It
Pick fixed intervals for each cost bucket and don't deviate from them unless something extraordinary happens — a fuel spike large enough to threaten margin on every active lane counts as extraordinary; a routine 10-cent weekly wobble doesn't.
- Recalculate fixed costs per mile quarterly, or immediately after a major equipment purchase, insurance renewal, or permit change.
- Recalculate variable costs other than fuel (maintenance, tires) monthly, based on actual spend against actual miles.
- Recalculate your fuel cost-per-mile line weekly, using your rolling average, not daily spot prices.
- Review customer fuel surcharges against the published EIA average on the same weekly cycle.
- Review driver pay fuel adjustments only when the rolling average crosses your pre-set trigger threshold.
- Audit the whole model against actual settlement and invoicing data once a quarter to catch drift between what you assumed and what actually happened.
Keeping these schedules separate is the entire point. A quarterly fixed-cost number sitting next to a weekly fuel number gives you a cost-per-mile figure that's accurate without needing a full rebuild every time the price board changes.
The hard part of this whole process isn't the math — it's keeping fuel costs, driver settlements, and lane profitability connected without re-entering numbers across three spreadsheets. Yolda's accounting tools let you ask which lanes made money last month or whether maintenance costs are creeping up on a specific truck, in plain English, pulling from the same data that feeds your invoices and driver settlements — so your cost-per-mile model stays grounded in what actually happened, not what you assumed when you quoted the lane.
If you're ready to stop rebuilding this model by hand every time diesel moves, book a demo with Yolda and see how the numbers connect across dispatch, settlements, and IFTA on one platform.
Checklist: Building a Cost Per Mile Model That Survives Fuel Volatility
- Separate your total costs into a fixed bucket and a variable bucket.
- Calculate fixed cost per mile using a quarterly total divided by quarterly miles.
- Build a standalone fuel cost-per-mile line using MPG and price per gallon.
- Pull a 4- to 6-week rolling average diesel price instead of using today's spot price.
- Set a dollar-amount trigger threshold for when driver pay fuel adjustments kick in.
- Tie customer fuel surcharges to the same published index you use internally.
- Schedule fixed-cost reviews quarterly and fuel-line reviews weekly — don't mix the two.
- Audit the full model against actual invoicing and settlement data every quarter.
