
Quick answer: A trucking cost per mile calculator only stays accurate if it separates costs that move with fuel prices from costs that don't, and updates the fuel-driven ones as soon as diesel shifts by a meaningful amount. Most fleets calculate cost per mile once a quarter using an average diesel price, then quietly run at a loss or leave margin on the table for weeks when the market moves. The fix is a five-bucket model — fuel, fixed overhead, variable maintenance, insurance per mile, and driver pay — rebuilt from your own actuals, not industry averages.
Key takeaways
- A $0.15-per-gallon diesel swing changes cost per mile by roughly 2 to 2.5 cents on a truck averaging 6 miles per gallon — small per mile, but it adds up to real money across a 100,000-mile year.
- Fixed costs (truck payment, permits, base insurance) don't move with fuel and shouldn't be recalculated every time diesel does — only the fuel and fuel-linked pay lines need frequent updates.
- The U.S. Energy Information Administration publishes weekly on-highway diesel prices, which is the most practical benchmark for deciding when a recalculation is actually warranted.
- Recalculating too often creates its own problem — driver pay that changes weekly erodes trust, so most fleets are better served by a documented trigger point, not daily adjustments.
Why One Cost-Per-Mile Number Stops Working Mid-Quarter
A single cost-per-mile figure fails the moment diesel moves enough to change your fuel cost per mile but your pricing, contracts, and driver pay were all built around the old number. Say you quoted a lane at $2.10 per mile in January, based on diesel at $3.60 a gallon. By March, diesel is at $3.95. Your fuel cost per mile just went up roughly 2 cents on a 6-mpg truck — but your contract rate didn't, and if your driver pay is a flat rate per mile, their take hasn't adjusted either, which means the margin squeeze is landing entirely on the company.
This is the core problem with treating cost per mile as one static number. It's actually a stack of several different numbers, some of which move with fuel and some of which never do. When fleets blend them into a single average and recalculate once a quarter, they're flying blind for most of that quarter whenever diesel is volatile — and diesel is almost always volatile to some degree.
The U.S. Energy Information Administration tracks weekly average on-highway diesel prices by region, and anyone who's watched that series over the past few years knows it doesn't sit still. A plan built on a quarterly average can be meaningfully wrong by week three.
We've covered the mechanics of this breakdown in more detail in Trucking Cost Per Mile Calculator for Diesel Spikes — this guide focuses on the step-by-step process of building a model that holds up.
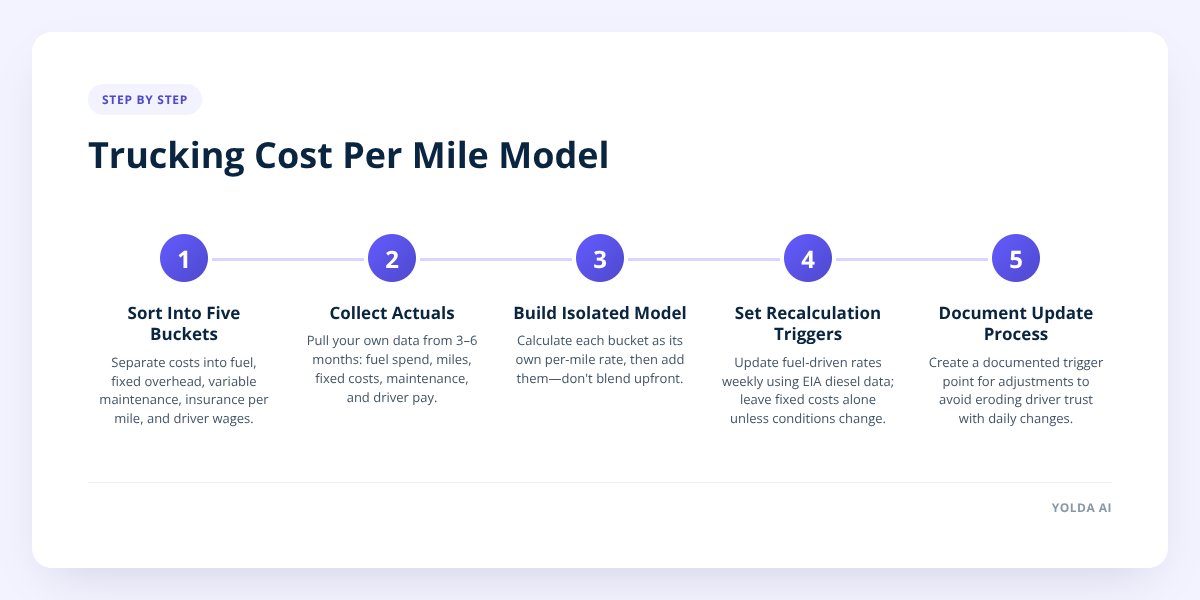
Step 1: Sort Your Costs Into Five Buckets
Before you can calculate anything accurately, you need to know which of your costs actually respond to fuel price changes and which stay flat no matter what diesel does.
- Fuel itself. Moves directly and immediately with the price per gallon. This is the most volatile line in your entire cost structure.
- Fixed overhead. Truck and trailer payments, base insurance premiums, permits, office costs, software subscriptions. These don't change with fuel at all — they only change with mileage or time.
- Variable maintenance. Tires, oil, brakes, scheduled service. This tracks with miles driven, not fuel price, but higher fuel costs can indirectly affect it if drivers change routes or idle more to manage fuel burn.
- Insurance per mile. Your total premium is usually fixed, but the per-mile figure changes based on how many miles you actually run — a slow month inflates this number even though the premium itself didn't change.
- Driver wages, by pay model. Mileage-based pay is fixed regardless of fuel. Percentage-of-load pay scales with revenue, not fuel. Fuel-surcharge-linked pay is designed to move with diesel — and if you don't have that structure, your driver absorbs none of the volatility while the company absorbs all of it.
Getting this sorted matters more than any formula. A calculator that lumps all five into one blended rate per mile will look reasonable on paper and still mislead you the week diesel jumps 15 cents.
Step 2: Collect Your Actuals — Not Industry Averages
Pull your own numbers from the last three to six months rather than relying on a generic per-mile estimate from a trade publication or a rule-of-thumb figure.
You'll need:
- Total fuel spend and total gallons purchased, broken out by month
- Total miles run in the same period, ideally by truck
- Fixed monthly costs: truck/trailer payments, base insurance, permits, software, office overhead
- Maintenance spend by month, separated from fuel
- Total driver pay by month, noted by pay structure (mileage, percentage, hourly, or surcharge-adjusted)
This step is where most DIY spreadsheets break down — not because the math is hard, but because the data lives in five different places: a fuel card portal, a maintenance shop invoice folder, an insurance statement, and a payroll export that doesn't match any of it. A platform like Yolda that keeps dispatch, accounting, and driver settlements on one login makes this pull-together step a matter of asking a question instead of reconciling four spreadsheets — its built-in financial assistant can answer "what was our fuel cost per mile last month by truck" directly from the company's own data.
Step 3: Build the Model So Fuel Is Isolated
With actuals in hand, calculate each bucket as its own per-mile rate, then add them together — don't blend them upfront.
| Cost bucket | How to calculate per-mile rate | How often to recheck |
|---|---|---|
| Fuel | (Total fuel spend ÷ total miles) | Weekly or when diesel moves 10¢+ |
| Fixed overhead | (Monthly fixed costs ÷ monthly miles) | Monthly |
| Variable maintenance | (Maintenance spend ÷ miles, trailing 3-month average) | Quarterly |
| Insurance per mile | (Monthly premium ÷ actual miles run) | Monthly |
| Driver pay | Depends on pay model — flat rate, percentage, or surcharge-linked | Per pay model's own schedule |
Add the five rates together and you have a true cost per mile that reflects what's actually happening in your business this month, not a number from the last planning cycle. The fuel line is the one that needs the most frequent attention, because it's the one most likely to drift from the assumption your rate was built on.
Step 4: Walk Through a $0.15-Per-Gallon Swing
Take a truck averaging 6 miles per gallon, running 9,000 miles a month.
At $3.70 a gallon, fuel cost is $3.70 ÷ 6 = $0.617 per mile. At $3.85 a gallon — a 15-cent jump — fuel cost becomes $3.85 ÷ 6 = $0.642 per mile.
That's a difference of about 2.5 cents per mile. On 9,000 miles in a month, that's roughly $225 in added fuel cost the fleet didn't have the month before — on one truck. Across a 10-truck fleet, that's upwards of $2,000 a month in margin erosion that a quarterly-average calculation wouldn't surface until the quarter closed.
Now layer in the breakeven math. If your contract rate on a lane is $2.15 per mile and your total cost per mile (all five buckets combined) was $1.98 before the swing, your margin was $0.17 per mile. After the swing, if nothing else changes, your cost per mile rises to roughly $2.005 — and your margin drops to $0.145 per mile, a margin cut of about 15% from one fuel move. That's the kind of shift that's invisible in a single blended number but obvious the moment fuel is isolated as its own line.
Don't skip this: if your driver pay includes any fuel-surcharge component, recalculate that pay line at the same time you recalculate cost per mile — otherwise the settlement and the cost model drift apart, and reconciling them later is far more work than keeping them in sync now. We've walked through that recalculation specifically in How to Recalculate Driver Settlements When Fuel Prices Drop.
Step 5: Decide When to Actually Recalculate
Recalculate your fuel line whenever diesel moves by an amount that changes your per-mile cost by more than a cent or two — for most fleets, that's somewhere around a 10 to 15 cent swing in the price per gallon, not every single day it ticks up or down.
Set a clear trigger instead of reacting to every headline about diesel prices:
- Recalculate the fuel line weekly if diesel is unusually volatile, using the EIA's published weekly average for your region as the reference point.
- Recalculate fixed overhead and insurance-per-mile monthly, since those move with your own mileage, not the market.
- Recalculate maintenance on a trailing quarterly average — a single pothole month shouldn't reset your whole model.
- Hold driver pay recalculations to a documented schedule (weekly or biweekly settlement cycles) rather than ad hoc changes, so drivers can predict their pay.
- Rebuild the full five-bucket model at least quarterly even if nothing seems to have moved, since small drifts compound.
Over-automating this is its own mistake. A cost-per-mile figure that changes daily, or driver pay that shifts mid-pay-period without warning, creates confusion and erodes trust faster than a slightly stale number does. The goal is a model that's accurate enough to act on, not one that's recalculated so often nobody can explain why a number changed.
What to Do Next
Start by pulling your last three months of actuals into the five-bucket format above, even before diesel moves again — that baseline is what makes the next recalculation fast instead of a scramble. If reconciling fuel, maintenance, insurance, and driver pay across separate systems is the hard part, that's exactly the gap Yolda's accounting module is built to close, since it pulls invoicing, expenses, and settlement data into one place a dispatcher or owner can actually query in plain English.
Ready to see your real cost per mile instead of a quarterly guess? Book a demo or start a free trial with Yolda.
Checklist: Building a Fuel-Resilient Cost Per Mile Model
- Pull total fuel spend and gallons purchased for the last three to six months.
- Separate fixed overhead costs from variable maintenance costs in your records.
- Calculate insurance per mile using actual miles run, not estimated miles.
- Note each driver's pay structure — mileage, percentage, or fuel-surcharge-linked.
- Calculate each of the five cost buckets as its own per-mile rate.
- Add the five rates together to get your true blended cost per mile.
- Set a diesel price trigger (such as a 10 to 15 cent move) for recalculating the fuel line.
- Recalculate fixed costs and insurance monthly, maintenance quarterly.
- Check that any fuel-surcharge driver pay updates alongside the cost model, not after it.
- Rebuild the full model quarterly even if no single trigger has been hit.

